Call Wall, Put Wall and Gamma Flip, Explained Simply
Three levels sit on top of every gamma exposure dashboard. Here is what each one is built from, how to read the three together on a real chain, and why none of them is a price target.
Open any gamma exposure dashboard and three numbers sit above everything else: the call wall, the put wall and the gamma flip. On NVDA, after the close on 23 September 2026, GammaGrid showed them like this:
| Level | NVDA | Distance from price |
|---|---|---|
| Call wall | 230 | 2.0% above |
| Price | 225.51 | — |
| Gamma flip | 220.95 | 2.0% below |
| Put wall | 200 | 11.3% below |
In GammaGrid they sit in the gamma weather card at the top of every ticker, next to the price:
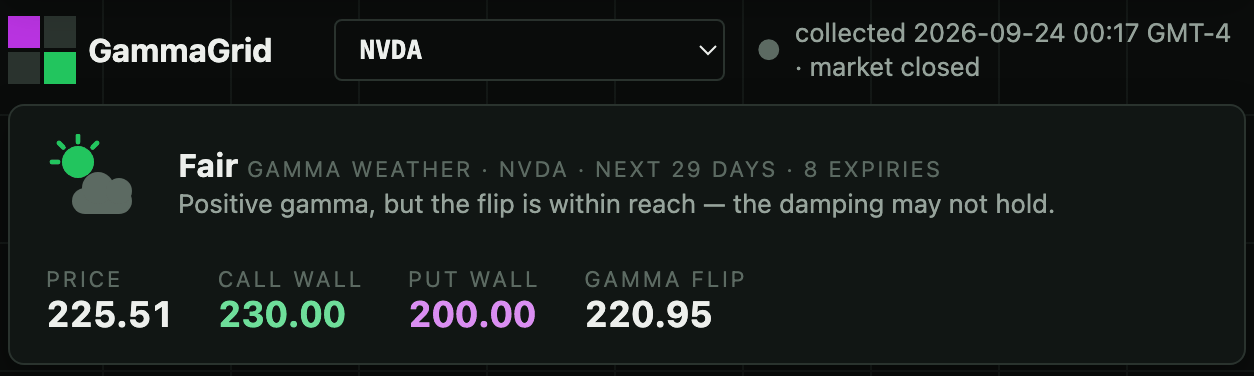
By the end of this lesson you will know what each of those numbers is made of, and you will be able to read the four lines in about ten seconds. You need two ideas first.
Two ideas you need first
Open interest is the number of option contracts that are still open at a strike — bought by someone, sold by someone, and not yet closed or expired. It is not how much traded today; that is volume. Open interest is counted once a day, after the close.
Gamma needs only one sentence here. The dealers who sell options hedge them with shares, and the number of shares they need changes as the price moves; gamma is how fast that number changes. Whether their hedging calms the price down or pushes it further depends on the sign of their total gamma — lesson 5 takes that apart. This lesson only needs to know where the sign changes.
Everything below is measured over the expiries in the next 30 days — for NVDA that was eight of them, from 25 September to 23 October. Contracts expiring later are left out.
The call wall: where the most calls are open
The call wall is the strike with the most open call contracts. That is the whole definition. On NVDA it was 230, with 185,057 call contracts open across those eight expiries — more than at any other strike.
Why people watch it: someone sold every one of those calls, and the dealers among the sellers hedge by holding shares. As the price climbs towards a strike with that much open interest, a lot of hedging is concentrated in one place. That is why a call wall often behaves like a ceiling. Often is the important word: it is a place where many positions sit, not an order to sell.
The put wall: where the most puts are open
The put wall is the same thing for puts: the strike with the most open put contracts. On NVDA it was 200, with 129,682 puts open. People read it as a floor, for the same reason and with the same "often".
A put wall can also be far away. On the same night SPY closed at 767.81 and its put wall was at 525 — almost a third below the price. Large blocks of protective puts sit at round strikes for months. A wall that far away is not a level anyone is defending this month, so read the distance before you read the wall.
The chart shows it: calls above the line, puts below, and one tall bar on each side. Those two bars are the walls. Notice that neither of them is next to the price.
The gamma flip: where the regime changes
The flip is not a strike where a lot of anything sits. It is a point on the price scale, and finding it takes three steps:
- For every strike, estimate the dealers' gamma — green bars where it is positive, purple where it is negative.
- Add the bars up from the lowest strike to the highest, keeping a running total.
- The gamma flip is where that running total crosses zero. If it crosses more than once, take the crossing closest to the price.
On NVDA the running total was still negative at 220 and already positive at 222.5, so it crossed zero in between — at 220.95. Across the whole chain the dealers' gamma added up to +$506 million: positive.
What the flip means: while the price is above it, dealer hedging tends to lean against moves — they sell into rallies and buy into dips, which damps the price. Below it, hedging leans with the moves and can make them bigger. That is why every chart in GammaGrid uses green for damping and purple for amplifying.
Reading the three together
Put the four numbers on one line, lowest to highest: put wall 200 — flip 220.95 — price 225.51 — call wall 230. Then ask two questions.
Which side of the flip is the price on? Above it, by 2%. Dealer hedging is damping moves for now, but an ordinary day or two could take the price across. GammaGrid sums this up as the gamma weather Fair: positive gamma, with the flip within reach.
How far away are the walls? The call wall is 2% above — close. The put wall is 11% below — far, and below the flip. If the price fell through the flip, it would be in the amplifying regime long before it got anywhere near the put wall.
You will meet three other shapes:
- The price sitting on the flip. AAPL that same night: price 337.02, flip 337.10. The regime can turn either way, and the card says Unsettled.
- No flip at all. SPY that night: the running total never crossed zero inside the strike range, so there is no flip to report, only the sign — negative. The card says Storm and shows a dash instead of a number.
- The price below the flip. Hedging amplifies moves until the price gets back above it — the purple side of the chart.
Open NVDA in the demo and find the three levels at the top of the screen, next to the price. The demo updates about every fifteen minutes while the market is open, so the numbers will have moved since this lesson was written. Is the price still between the flip and the call wall? Which weather word does the card show?
Open the demo →What this does not tell you
Is the call wall a price target?
No. The call wall is where the most call contracts are open, and it says nothing about where the price will go. Moves often slow down near it, and sometimes the price goes straight through.
Will the price bounce off the put wall?
Sometimes. A wall is open interest, not a standing order to buy. Open interest is counted once a day, so a wall can also move overnight — the Changes view shows by how many strikes.
Is the gamma flip an exact number?
No, it is an estimate. Nobody publishes which side of each contract the dealers are on, so GammaGrid, like every gamma exposure tool, relies on a standard assumption. It also computes gamma at the current price and over the next 30 days only. Treat the flip as a zone rather than a line, and look at how far the price is from it.
Read these levels on your own tickers
GammaGrid computes the walls, the flip and the gamma weather for any US-listed ticker with options, keeps every chain it collects, and shows you what changed since yesterday. Free while it is in beta.
Open GammaGrid →Or look around first, no sign-in: the live demo