Dealers, Hedging and Gamma: Positive vs Negative Gamma, Explained Simply
The whole idea behind gamma exposure in four steps: dealers take the other side of options trades, dealers hedge with shares, the hedge has to change as the price moves, and the direction of that change decides whether moves get calmer or bigger.
Every lesson from here on rests on one idea: the people who sell options have to trade the stock to stay safe, and how they trade depends on where the price is going. This lesson is that idea in four steps.
Step 1: dealers take the other side and do not want to bet
When you buy or sell an option, the other side of the trade is often a dealer — a market maker whose business is to quote prices all day and earn the small difference between buying and selling. A dealer does not want to be right about the stock. A dealer wants to be flat.
Step 2: they hedge with shares — that is delta
A dealer who sold you a call loses money if the stock rises. To cancel that out, the dealer buys some shares. How many is called delta: a call with delta 0.50 needs about 50 shares per contract to be neutral.
Delta is not fixed. A call that is far out of the money has a small delta; as the price rises towards its strike, its delta grows, and the dealer needs more shares.
Step 3: the hedge has to change — that is gamma
Gamma is how fast delta changes when the price moves by a dollar. High gamma means the hedge goes out of date quickly and the dealer has to trade often. Gamma is highest for contracts near the money and close to expiry.
So every price move forces dealers to buy or sell shares just to stay flat. On a busy stock that is a lot of shares.
Step 4: the sign decides the direction
Add up the gamma of all the dealers' positions and you get one number with a sign.
Positive dealer gamma. When the price rises, dealers end up with too many shares and sell some; when it falls, they buy. They trade against the move, which tends to calm the price down. On GammaGrid's charts this is green.
Negative dealer gamma. When the price rises, dealers have to buy more; when it falls, they sell. They trade with the move, which can make it bigger. On GammaGrid's charts this is purple.
Nobody publishes which side of each contract the dealers are on. GammaGrid, like most gamma exposure tools, uses a standard assumption: calls count as positive dealer gamma and puts as negative. Behind it is a picture of who usually trades with dealers — investors selling calls against shares they own, which leaves dealers holding those calls, and investors buying puts for protection, which leaves dealers short them. It is an assumption, not an observation: public data cannot confirm it, and when investors are mostly buying calls or selling puts it points the wrong way. That is why every GEX number is an estimate, not a fact.
What the number means: GEX in dollars
GammaGrid writes the total as net GEX — gamma exposure — in dollars: how many dollars of stock the dealers' hedges would need to shift for each $1 move in the price.
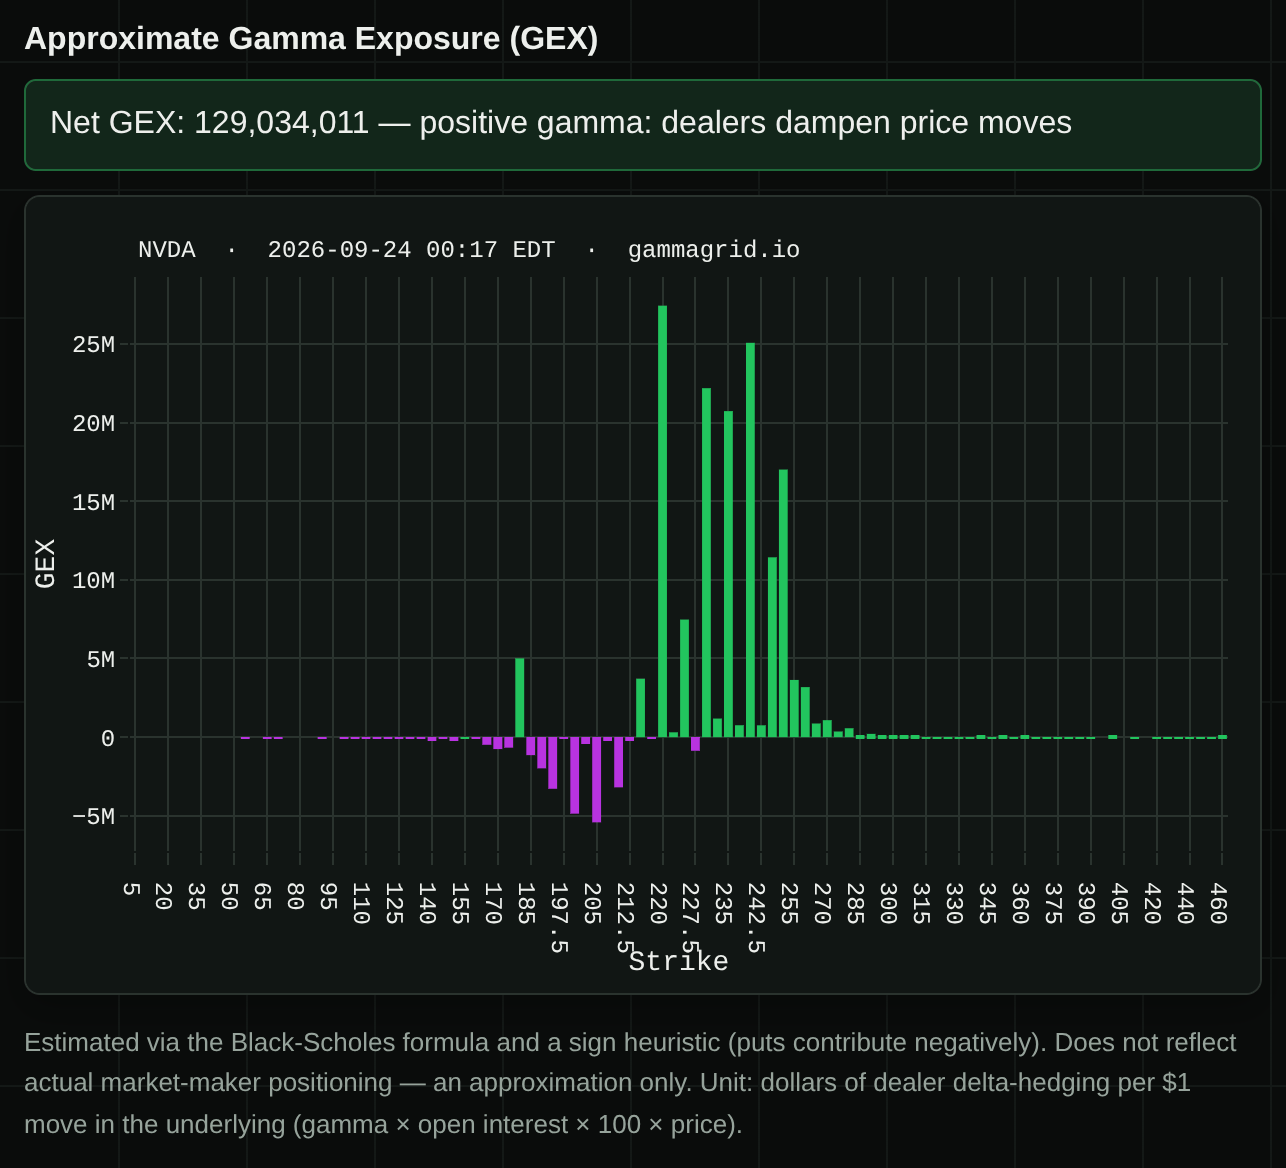
For NVDA's 16 October expiry, net GEX was +$129 million: for every dollar NVDA moves, the hedges tied to that one expiry would need to shift by roughly $129 million of stock — against the move, because the sign is positive.
The chart underneath shows where it comes from. The green bars sit between about 220 and 255, around and above the price of 225.51. The purple bars below 215 are small. Most of the exposure is near the money, where gamma is highest.
Each expiry has its own number. Across all eight expiries in the next 30 days, NVDA's net GEX added up to +$506 million — the nearest expiry, 25 September, alone contributed +$280 million, because it was two days away and gamma is highest close to expiry.
Why this is the base for everything else
The walls, the flip and the gamma weather are all built on this one number:
- where the total changes sign is the gamma flip — lesson 6;
- the strikes with the most open contracts are the walls — lesson 6;
- the GEX of every strike and expiry at once is the heatmap — lesson 7.
Open NVDA's Max Pain / GEX view in the demo and scroll to the GEX chart. Switch expiries and watch the green line under the title — net GEX for that expiry — change size, and on some tickers sign.
Open the demo →What this does not tell you
Does positive gamma mean the price will go up?
No. The sign says whether dealer hedging tends to damp moves or amplify them, not which way the price goes. A stock can fall steadily with positive gamma — just less violently.
Is net GEX the dealers' real position?
No. It is an estimate from public open interest and a rule of thumb about which side dealers are on. Read the sign and how it changes; do not read the exact dollars as a fact.
Why does GEX change during the day if open interest is counted once a day?
Because gamma depends on the price and on time. As the price moves and expiry gets closer, the same open interest carries different gamma, so the estimate moves even when open interest does not.
Read these levels on your own tickers
GammaGrid computes the walls, the flip and the gamma weather for any US-listed ticker with options, keeps every chain it collects, and shows you what changed since yesterday. Free while it is in beta.
Open GammaGrid →Or look around first, no sign-in: the live demo