Max Pain, Explained Simply — and How Often It Actually Holds
Max pain is the price at which option buyers, all together, would lose the most at expiry. Here is how it is calculated, why every expiry has its own, and what happened when we checked whether prices actually go there.
Max pain is a price. If the stock finished exactly there on expiry day, all the options expiring that day — calls and puts together — would pay their buyers the least money. The name comes from the buyers' side: that is where they would feel the most pain.
How it is calculated
It is plain arithmetic over open interest, no model needed:
- Pick a candidate price — say, one of the listed strikes.
- Work out what every open contract would be worth at expiry if the stock finished there. A call is worth the amount the price is above its strike, a put the amount the price is below its strike, and everything else is worth zero.
- Multiply by open interest and add it all up — that is the total payout at that price.
- Repeat for every candidate. The one with the smallest total is max pain.
Because it is built from one expiry's open interest, every expiry has its own max pain. There is no single max pain for a stock.
A real example: two expiries, two answers
NVDA after the close on 23 September 2026, price 225.51:
| Expiry | Max pain | Distance from price |
|---|---|---|
| 25 September (2 days away) | 220 | 2.4% below |
| 16 October (3 weeks away) | 205 | 9.1% below |
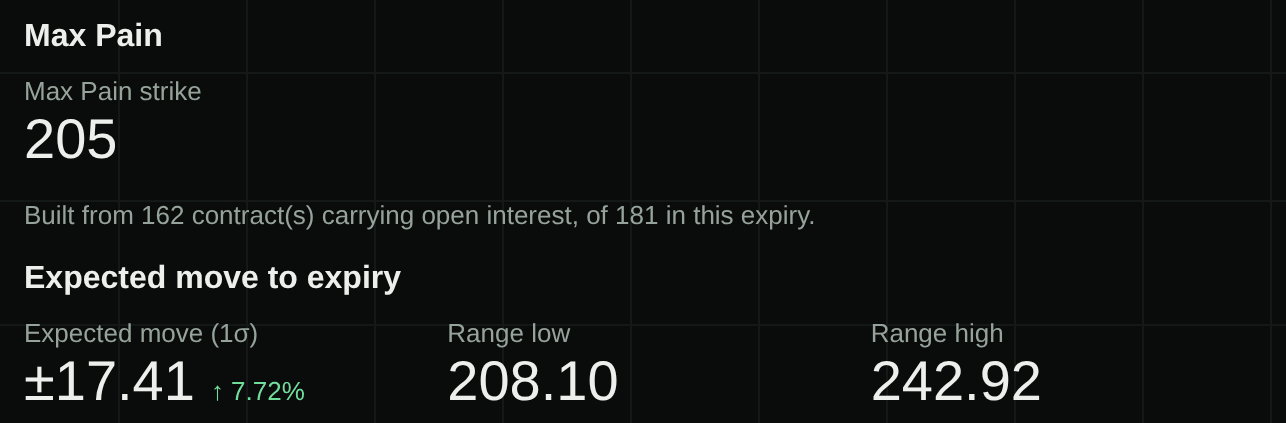
Notice two things on the screen.
"Built from 162 contracts carrying open interest, of 181 in this expiry." Max pain is only as good as the open interest behind it. GammaGrid says how many contracts it used and leaves out expiries with too few — on a thin chain the number is a handful of positions, not a level.
The expected move sits right under it — lesson 3. For 16 October, max pain at 205 is below the whole one-standard-deviation range of 208.10–242.92. The options market is not pricing a trip to max pain as the likely outcome.
The theory: pinning
The story behind max pain goes like this. The sellers of options — many of them dealers — hedge their positions with shares. As expiry gets close, that hedging is said to pull the price towards the strike where the sellers pay out the least. The effect, where it exists, is supposed to strengthen in the last days before expiry.
It is a good story. It is also easy to check if you keep the chains.
What happened when we checked
GammaGrid keeps every chain it collects, so we measured it on 57 real expiries, mostly large ETFs: max pain from the evening before expiry, against where the price finished the next day.
| On 57 expiries | |
|---|---|
| Finished within 0.5% of max pain | 8 |
| Finished within 1% | 15 |
| Median distance at the finish | 2.04% |
| Moved towards max pain on the last day | 19 |
| Moved away from it | 38 |
Price moved away from max pain twice as often as towards it. That is one sample, mostly SPY, GLD, QQQ and SLV, and the full write-up says why that matters — Max Pain Didn't Pin. But it is enough to say this: max pain is a description of where open interest sits, not a forecast.
GammaGrid shows the same check for each ticker you watch, as Does max pain hold here? — the typical miss on that ticker's own past expiries. It grows only with time, because it needs expiries that have already happened.
Open NVDA's Max Pain / GEX view in the demo and switch between two or three expiries. How far is each expiry's max pain from the price, and does it move closer as the date gets nearer?
Open the demo →What this does not tell you
Will the price go to max pain by expiry?
Usually not. On 57 real expiries it finished within 0.5% only 8 times, and moved away more often than towards it.
Why does max pain jump when an expiry passes?
Because the next expiry has its own open interest and its own max pain. Compare max pain only for the same expiry from day to day — the Changes view does exactly that, and says so when the nearest expiry rolls off.
Is max pain useful at all?
As a description, yes: it tells you where the open interest of one expiry is concentrated. Read it next to the walls and the expected move, not as a target.
Read these levels on your own tickers
GammaGrid computes the walls, the flip and the gamma weather for any US-listed ticker with options, keeps every chain it collects, and shows you what changed since yesterday. Free while it is in beta.
Open GammaGrid →Or look around first, no sign-in: the live demo