Implied Volatility, Skew and the Expected Move, Explained Simply
Implied volatility is the price of movement, written as a percentage. Here is how to turn it into dollars, why it is higher on some strikes than others, and which parts of the chart to ignore.
An option's price depends on how far the stock might move before expiry. Implied volatility — IV — is that expected movement, worked backwards from the option's price and written as a yearly percentage. Nobody sets it; it falls out of what people are paying.
High IV means options are expensive because the market prices big moves. Low IV means options are cheap because it prices small ones.
From a percentage to dollars: the expected move
A yearly percentage is hard to picture, so GammaGrid turns it into the expected move: how far the price could travel by a given expiry, in the stock's own units.
The arithmetic is short: price × IV × √(time to expiry, in years).
NVDA after the close on 23 September 2026, for the 16 October expiry:
| NVDA, 16 Oct expiry | |
|---|---|
| Price | 225.51 |
| At-the-money IV | 31.0% |
| Time to expiry | 22.7 days |
| Expected move | ±17.41 (7.72%) |
| Range | 208.10 – 242.92 |
225.51 × 0.31 × √(22.7 ÷ 365) ≈ 17.4. That is one standard deviation: roughly a two-in-three chance of finishing inside the range, which also means about one expiry in three finishes outside it. That is normal, not a failed forecast — the range is a price, not a promise.
The same stock, a shorter horizon: the 25 September expiry, 1.7 days away, had IV 36.4% and an expected move of ±5.52. Shorter time, smaller move, even with higher IV.
Not one number: IV by strike
Every strike has its own IV. Draw them in a line and you get the curve on GammaGrid's Volatility view.
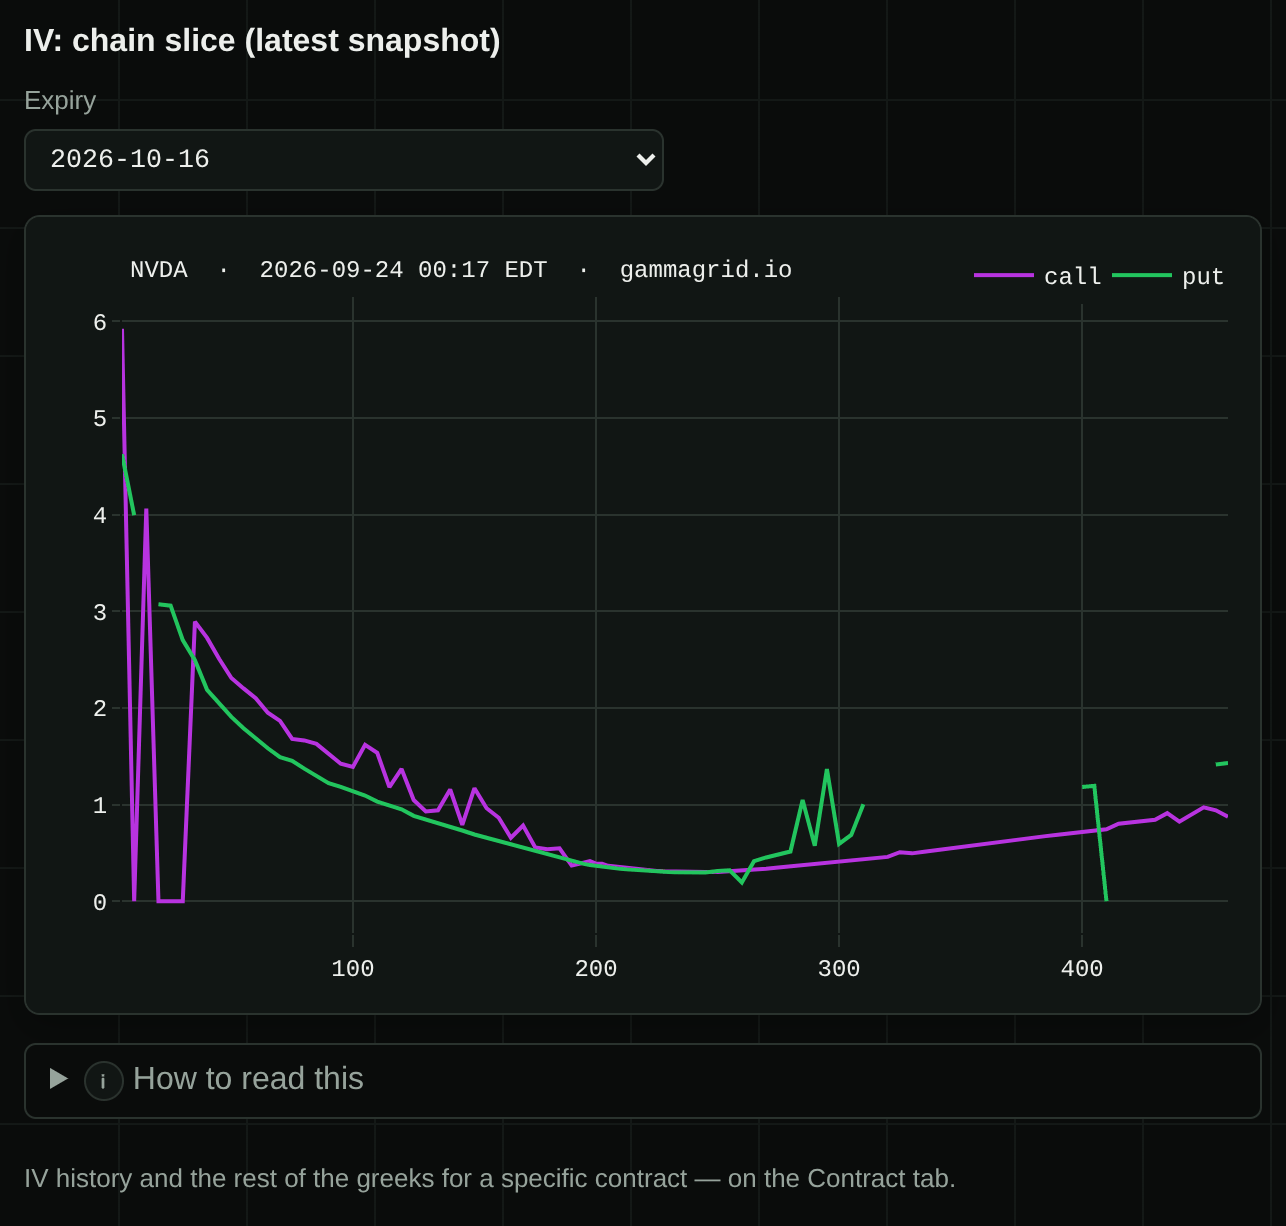
Read it from the middle out. Near the price, IV is lowest — about 30% around 225–250. Move away and it rises:
| Strike | Side that is out of the money | IV |
|---|---|---|
| 175 | put | 51% |
| 200 | put | 36% |
| 225 | at the money | 31% |
| 250 | call | 30% |
| 275 | call | 35% |
| 300 | call | 41% |
Two things show up.
The smile. IV rises on both sides of the price. Contracts far from the money are cheap in dollars, but in IV terms they are priced for big moves, because that is the only way they pay.
The skew. The low side rises faster than the high side: 25 dollars below the price costs 36%, 25 dollars above costs 30%. That is the demand for protection — people pay up for puts that insure against a fall. It is the normal shape for most stocks, not a warning.
Which parts to ignore
The far left of the chart jumps between zero and several hundred percent. Those are deep strikes that barely trade, where one stale price turns into an absurd IV. Read the curve where contracts actually trade — within a few expected moves of the price — and let the edges go.
Open NVDA's Volatility view in the demo, pick a monthly expiry three or four weeks out, and find the lowest point of the curve. Is it near the current price? Which side rises faster — the low strikes or the high ones?
Open the demo →What this does not tell you
Does high IV mean the price will fall?
No. IV measures how much movement is priced, not which way. It often rises before earnings or news, but a high number on its own says "big move expected", nothing more.
Is the expected move a target?
No. It is one standard deviation: about a third of the time the price ends outside the range, and that is ordinary.
Why do GammaGrid's IV numbers differ from my broker's?
IV is calculated, not quoted, and small choices change it — which price is used, the interest rate, dividends, the exact time to expiry. GammaGrid solves it from each contract's own delayed price where it can, and uses the data source's figure where it cannot, so treat differences of a point or two as noise.
Read these levels on your own tickers
GammaGrid computes the walls, the flip and the gamma weather for any US-listed ticker with options, keeps every chain it collects, and shows you what changed since yesterday. Free while it is in beta.
Open GammaGrid →Or look around first, no sign-in: the live demo