How to Read a GEX Heatmap
The heatmap is the whole chain's dealer gamma on one screen — strikes down the side, expiries across the top. Here is where to look first, what the colours mean, and why its levels do not always match the card above it.
Lesson 5 turned dealer gamma into one number, and lesson 6 into three levels. The heatmap goes the other way: it shows every piece of that number at once, so you can see where it comes from.
What is on the screen
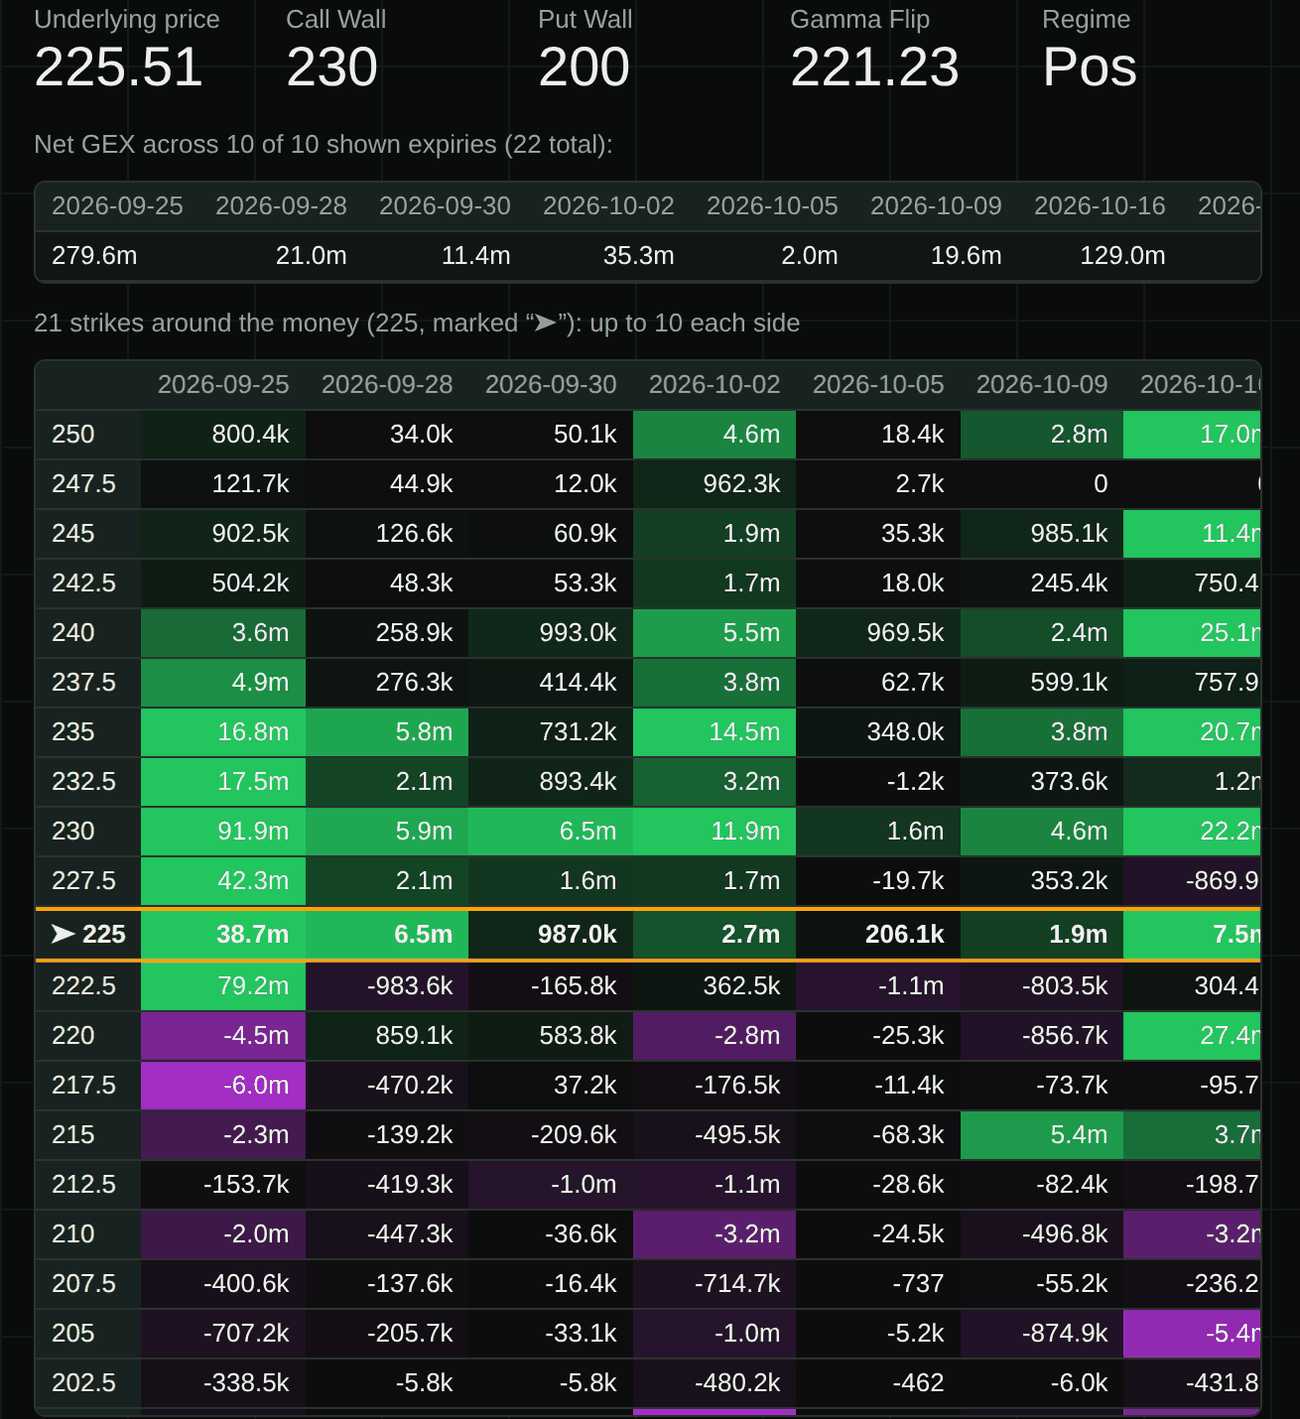
Top to bottom:
- The levels for what is shown: price, call wall, put wall, gamma flip, and the regime — Pos for positive dealer gamma, Neg for negative.
- Net GEX by expiry, one number per column: how much dealer gamma each expiry carries in total.
- The grid. Each row is a strike, each column an expiry, and each cell the estimated dealer gamma of that one strike in that one expiry — the same unit as lesson 5, dollars of hedging per $1 move. The row marked with an arrow is the strike nearest the price.
Numbers are shortened: 1.2k is 1,200, 1.5m is 1,500,000.
The colours
Green is positive dealer gamma — hedging that damps moves. Purple is negative — hedging that amplifies them. Near-black is close to zero. The brighter the cell, the bigger the number.
The scale is set by the 90th percentile of the values, not by the single largest cell. Otherwise one huge cell would make every other cell look nearly black. The price of that choice: the very largest cells are all painted the same brightest colour, so two cells that look equal may not be — the exact number is printed in the cell.
Where to look first
1. The arrow row. For NVDA it is 225, next to the price of 225.51. Everything above it is above the price, everything below is below.
2. Which side is green. On NVDA almost everything above the arrow is green. The two rows just below it are mixed, and from 217.5 down most cells are purple or close to zero. Dealer gamma is positive above the price and turns negative a few strikes below it. That boundary is the gamma flip — here 221.23, between the 220 and 222.5 rows.
3. Which column is brightest. The first column, 25 September, two days away, carries +$279.6 million — the most of the ten — with its brightest cell at 230: +$91.9 million. Gamma is highest close to expiry, so the nearest column usually dominates. The 16 October column is second, +$129.0 million: a monthly expiry, with a lot of open interest.
4. Single bright cells far from the arrow. A lone bright cell away from the money is one large block of open interest. It is worth knowing about, and it can be an old hedge rather than today's positioning.
Why the heatmap's flip differs from the card
The card at the top of every view said the gamma flip was 220.95. The heatmap says 221.23. Neither is wrong; they use different expiries.
The card uses every expiry in the next 30 days — eight for NVDA. The heatmap uses the expiries it shows — the nearest ten here, set by the slider. Different expiries, different running total, a slightly different crossing. On NVDA the two agree within 30 cents. On other tickers they can be further apart, which is why the gamma weather has its own fixed window — the full reasoning is in Gamma Weather Is Not a Real Options Term.
Replay
With a GammaGrid account, the Snapshot selector above the heatmap goes back through earlier collections; the demo shows the latest one only. The same grid for yesterday morning, or last Friday, shows how the green and purple moved — not just where they are now. That is the question lesson 11 builds a routine around.
Open NVDA's GEX Heatmap in the demo. Find the row marked with an arrow, then the brightest green and the brightest purple cells. Which expiry column holds most of the colour? Move the "Nearest expiries" slider and watch the gamma flip above the table change.
Open the demo →What this does not tell you
Is a bright green cell a price the stock will stop at?
No. It is where a lot of estimated dealer gamma sits. Moves often slow down around the brightest green rows near the price, and sometimes the price goes straight through them.
Can the heatmap's walls differ from the card's?
Yes, for the same reason as the flip: the heatmap uses the expiries it shows, the card uses the next 30 days. On NVDA that night both said 230 and 200; on another ticker, or with the slider moved, they can part. Change the slider and the heatmap's levels change with it.
Are these the dealers' real positions?
No. Every cell is an estimate from public open interest and a rule of thumb about which side dealers are on, computed at the current price. Read the pattern — where the green is, where the purple starts — more than any single number.
Read these levels on your own tickers
GammaGrid computes the walls, the flip and the gamma weather for any US-listed ticker with options, keeps every chain it collects, and shows you what changed since yesterday. Free while it is in beta.
Open GammaGrid →Or look around first, no sign-in: the live demo