Open Interest Changes Day to Day: Where Positions Were Opened and Closed
Open interest only changes when a position is opened or closed, so the day-to-day change is the closest thing to a record of what people actually committed to. Here is how to read it, row by row.
Lesson 1 separated volume from open interest: volume counts trades, open interest counts positions that exist. This lesson is about the change in open interest from one day to the next — the part of the story volume cannot tell.
What moves open interest
Open interest goes up when a trade creates a new position: a buyer opens and a seller opens.
It goes down when a trade closes one: both sides were holding and both are getting out.
It stays the same when an existing position just changes hands — one person closes, another opens. Heavy volume can leave open interest exactly where it was.
So a change in open interest is a record of commitment: someone opened something new, or closed something old. It is counted once a day, so GammaGrid compares the last snapshots of two different trading days, not two moments of the same day.
A real day: SPY, 22 → 23 September 2026
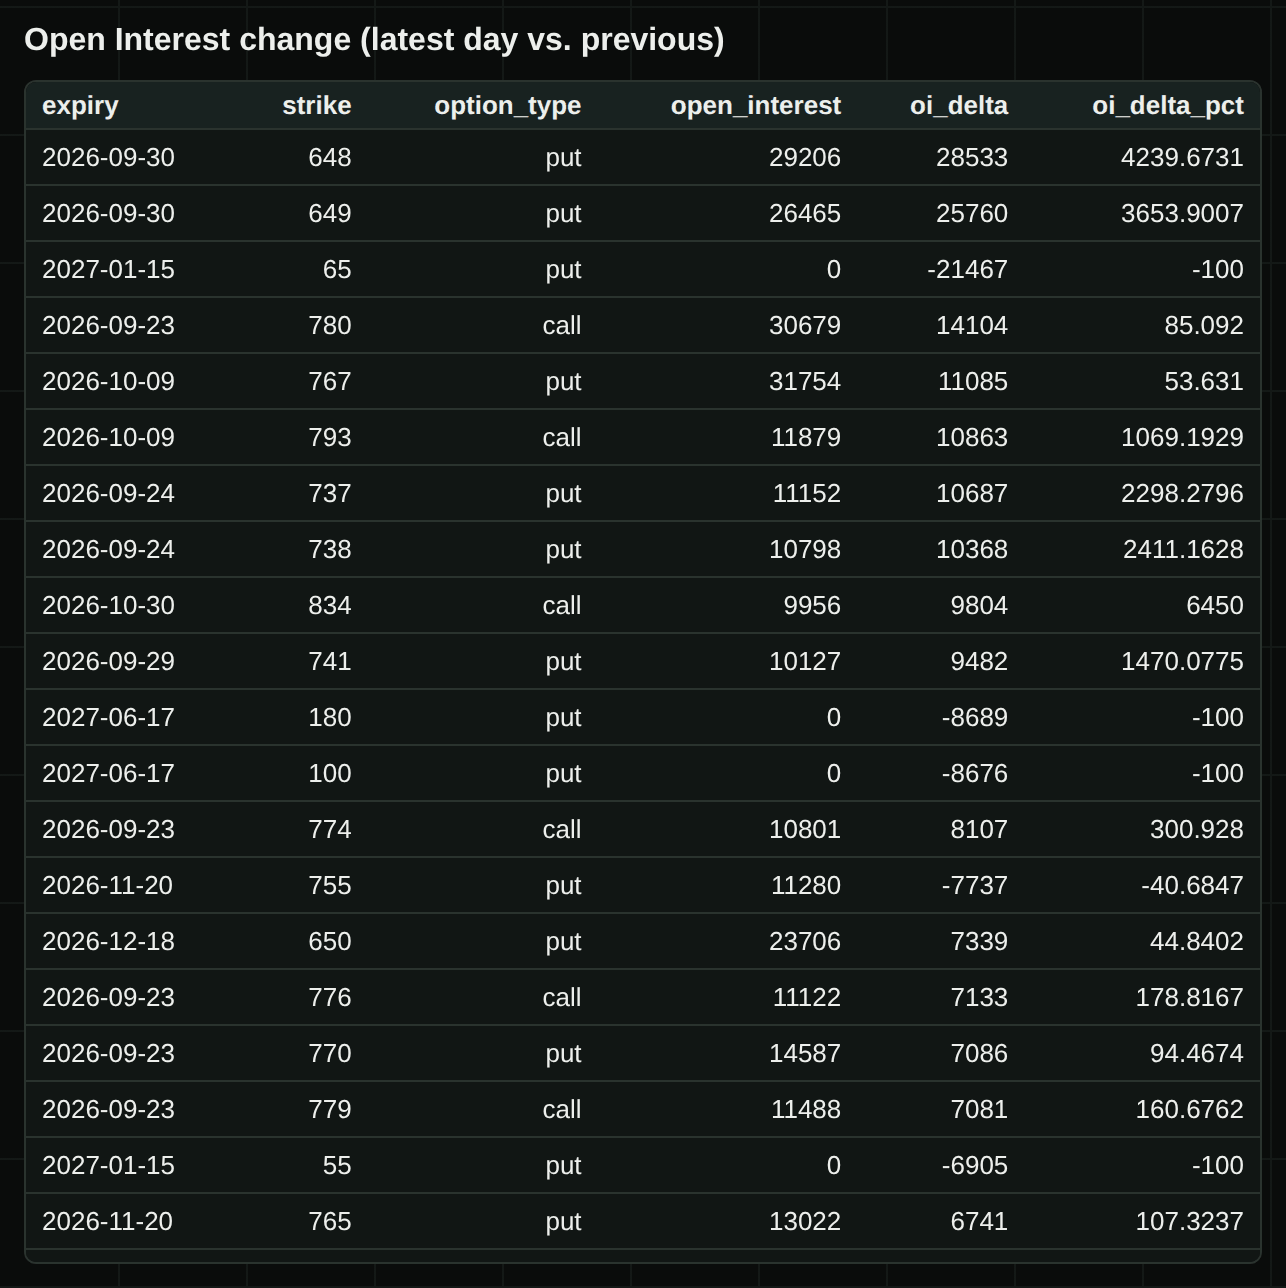
The columns:
| Column | Meaning |
|---|---|
| open_interest | open interest now, for scale |
| oi_delta | the change in contracts since the previous trading day: plus means opened, minus means closed |
| oi_delta_pct | the same change as a percentage of the previous value; empty if it started from zero |
Rows are sorted by the size of the change in contracts, in either direction. The largest moves are on top whatever their sign.
Reading the top rows
30 September, 648 and 649 puts: +28,533 and +25,760. Two neighbouring strikes, same expiry, both up by a similar amount in one day. Two legs moving together like this can be one trade — a spread — rather than two separate views. Both strikes are about 15% below the price of 767.34, one week out — a shape that looks more like protection than a bet on a crash, though the table itself cannot say which.
15 January 2027, 65 put: −21,467, to zero. A strike far below any realistic price, with over a year to run, emptied in a day. Two more far puts in 2027 went to exactly zero the same day. That can be old hedges being closed — or strikes missing from the delayed data that day. A drop to exactly zero on a far strike is worth checking again the next day before you read anything into it.
9 October, 767 put: +11,085 (+54%). Right at the money, a little over two weeks out: new puts opened exactly at the current price.
20 November, 755 put: −7,737 (−41%). Positions closed near the money, two months out.
Why the percentage can mislead
The first row says +4,240%. That is because the strike had only 673 contracts open the day before. A thousand new contracts on a strike that had ten is a huge percentage and a small position; ten thousand on a strike that had a hundred thousand is 10% and a big one. Read the absolute change first. The percentage only tells you how new the position is.
Why this matters for the other lessons
Walls, max pain and gamma exposure are all built from open interest. When open interest changes, they can change. A put wall that jumps overnight often has a row near the top of this table behind it — the Changes view in lesson 11 shows the wall's move, and this view shows the contracts behind it.
Open the OI Delta view for SPY or a ticker you follow (a free GammaGrid account). Look at the top five rows: how many are near the price, how many are far away, and are any two of them a pair of neighbouring strikes that moved by the same amount?
Open the demo →What this does not tell you
Did the buyers or the sellers open these positions?
This table cannot say. Every contract has both, and open interest records that a position exists, not who initiated the trade or which side is betting.
Does a big increase in puts mean people expect a fall?
Not necessarily. Many puts are insurance on shares, and some are one leg of a spread. Read where the strike is and when it expires before reading a mood into it.
Why can open interest change by less than the day's volume?
Because many trades just pass an existing position from one holder to another. Only opening and closing trades change open interest.
Read these levels on your own tickers
GammaGrid computes the walls, the flip and the gamma weather for any US-listed ticker with options, keeps every chain it collects, and shows you what changed since yesterday. Free while it is in beta.
Open GammaGrid →Or look around first, no sign-in: the live demo