Unusual Options Activity: What a Z-Score Flags, and Why It Is Not Insider News
An unusual-activity list is a list of contracts that traded far more than they normally do. Here is how "far more" is measured, why the top of the list is often not what it looks like, and what happened when we checked whether it predicts anything.
"Unusual options activity" sounds like someone knows something. What it measures is plainer: a contract traded a lot more today than it usually does. This lesson is about how "a lot more" is measured, and about what that measurement can and cannot tell you.
Normal is per contract
A thousand contracts is nothing for an at-the-money SPY option and enormous for a strike that trades five a day. So GammaGrid does not use one threshold for every strike. It compares each contract's volume today with that contract's own history — one number per day over the last 60 days.
The z-score, in plain words
The comparison comes out as a z-score: how many "normal wobbles" today's volume is above the contract's average.
- A contract that usually trades about 100 a day, give or take 20, and trades 160 today is 3 wobbles above normal: z = 3.
- GammaGrid flags a contract when z is above 2.5 and today's volume is at least 50 contracts — below that it is noise from illiquid far strikes.
- A contract without at least 5 days of history cannot have a z-score, so it gets a cruder check instead: flagged if today's volume is more than twice its open interest.
A real list: SPY, 23 September 2026
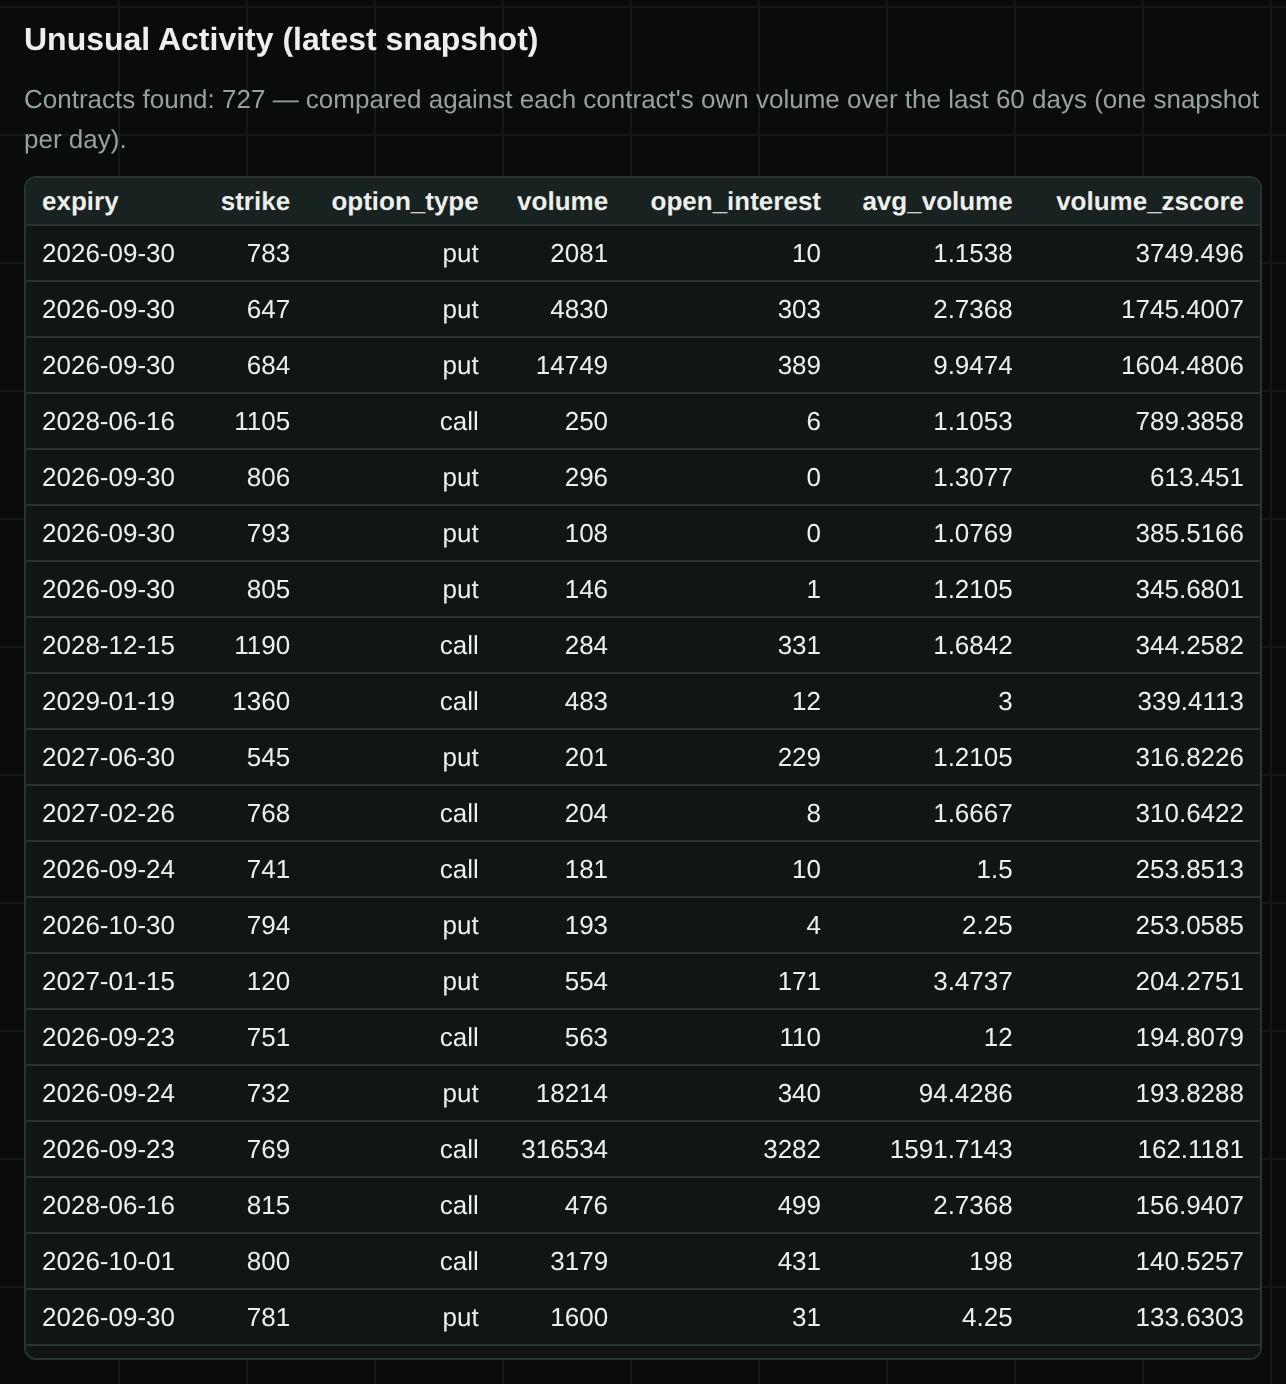
727 contracts were flagged that day. Read the top two rows and the reason becomes clear.
30 September, 783 put: volume 2,081, average 1.15, z = 3,749. On most days in the window this contract barely traded — about one contract a day. So 2,081 is thousands of wobbles above normal. The z-score is enormous because the history is almost flat, not because the trade was enormous.
23 September, 769 call: volume 316,534, average 1,591.7, z = 162. This contract expired that same day, and it was right at the money. On expiry day, volume at the money explodes — that is the ordinary life of a same-day option, not news.
Both rows are true: these contracts really did trade far more than usual. Neither says anything about who traded or why.
How to read the list
- Look at volume against open interest. A volume many times the open interest means the contract traded heavily against what is held — much of it opened, or opened and closed, that day. A volume below it can just be existing positions changing hands.
- Look at the average. An average near zero means a quiet contract woke up; a big average means a busy contract had a busier day. The z-score treats both the same.
- Look at the expiry. Same-day and next-day expiries often crowd the top.
- Then look at the strike. Far out of the money and far out in time is often protection or a spread leg.
What happened when we checked
GammaGrid keeps every chain, so we ran this exact detector — same thresholds — over every collected day, summed each day's flags into a call-heavy or put-heavy signal, and checked the next day's close. Across 519 signal-days, the price moved in the flagged direction 51.1% of the time. A coin flip is 50%. The full write-up is Does Unusual Options Activity Predict Anything?.
So a flag is a fact about volume: this happened, and rarely enough to be worth a look. It is not a signal about direction.
Open the Unusual Activity view for SPY or a ticker you follow (a free GammaGrid account). For the top ten rows, compare volume with open interest and with the average volume. Which rows are quiet contracts that suddenly traded, and which are busy contracts on an even busier day?
Open the demo →What this does not tell you
Is unusual activity insider trading?
No. A large trade can be a hedge for an entirely different position, a spread leg, or a fund rolling a position forward. The list shows that volume was unusual, not why.
Does a flagged call mean the price will go up?
Not on our data. Across 519 flagged days, direction matched the flag 51.1% of the time — about the same as not looking.
Why are there hundreds of flagged contracts on one ticker?
Because a busy chain has thousands of contracts, and on an active day many of them trade above their own normal. The z-score also gets very large on contracts with a short or quiet history, so a young history makes the list longer.
Read these levels on your own tickers
GammaGrid computes the walls, the flip and the gamma weather for any US-listed ticker with options, keeps every chain it collects, and shows you what changed since yesterday. Free while it is in beta.
Open GammaGrid →Or look around first, no sign-in: the live demo