The Options Chain: Strikes, Expiries, Calls, Puts and Open Interest
Every number on a gamma exposure dashboard is built from one table — the options chain. Here is what is in it, column by column, and how to read a single row out loud.
An option is a contract that gives its buyer the right to buy or sell 100 shares of a stock at a fixed price, until a fixed date. That is all you need to start. Everything a gamma exposure dashboard shows — walls, flips, max pain, put/call — is arithmetic over one big table of those contracts, called the options chain.
Two kinds of contract
A call is the right to buy the shares at the fixed price. People buy calls when they think the price will go up, or to cap what they would pay later.
A put is the right to sell the shares at the fixed price. People buy puts when they think the price will fall, or — very often — as insurance on shares they already own.
Every contract has a buyer and a seller. The buyer pays for the right; the seller takes the money and the obligation.
Two numbers that define a contract
The strike is the fixed price in the contract. A SPY 760 call is the right to buy SPY at $760.
The expiry is the last day the contract exists. After it, the contract is settled and gone.
A chain lists every strike for every expiry, calls and puts side by side. SPY is one of the busiest chains there is: on 23 September 2026 GammaGrid collected 9,956 SPY contracts across 31 expiries, from the same day out to years ahead. Nobody reads all of them. You pick a slice.
One slice of a real chain
Here is a slice from GammaGrid's Screener: the SPY expiry of 16 October 2026, strikes 755 to 762, with SPY at 767.34.
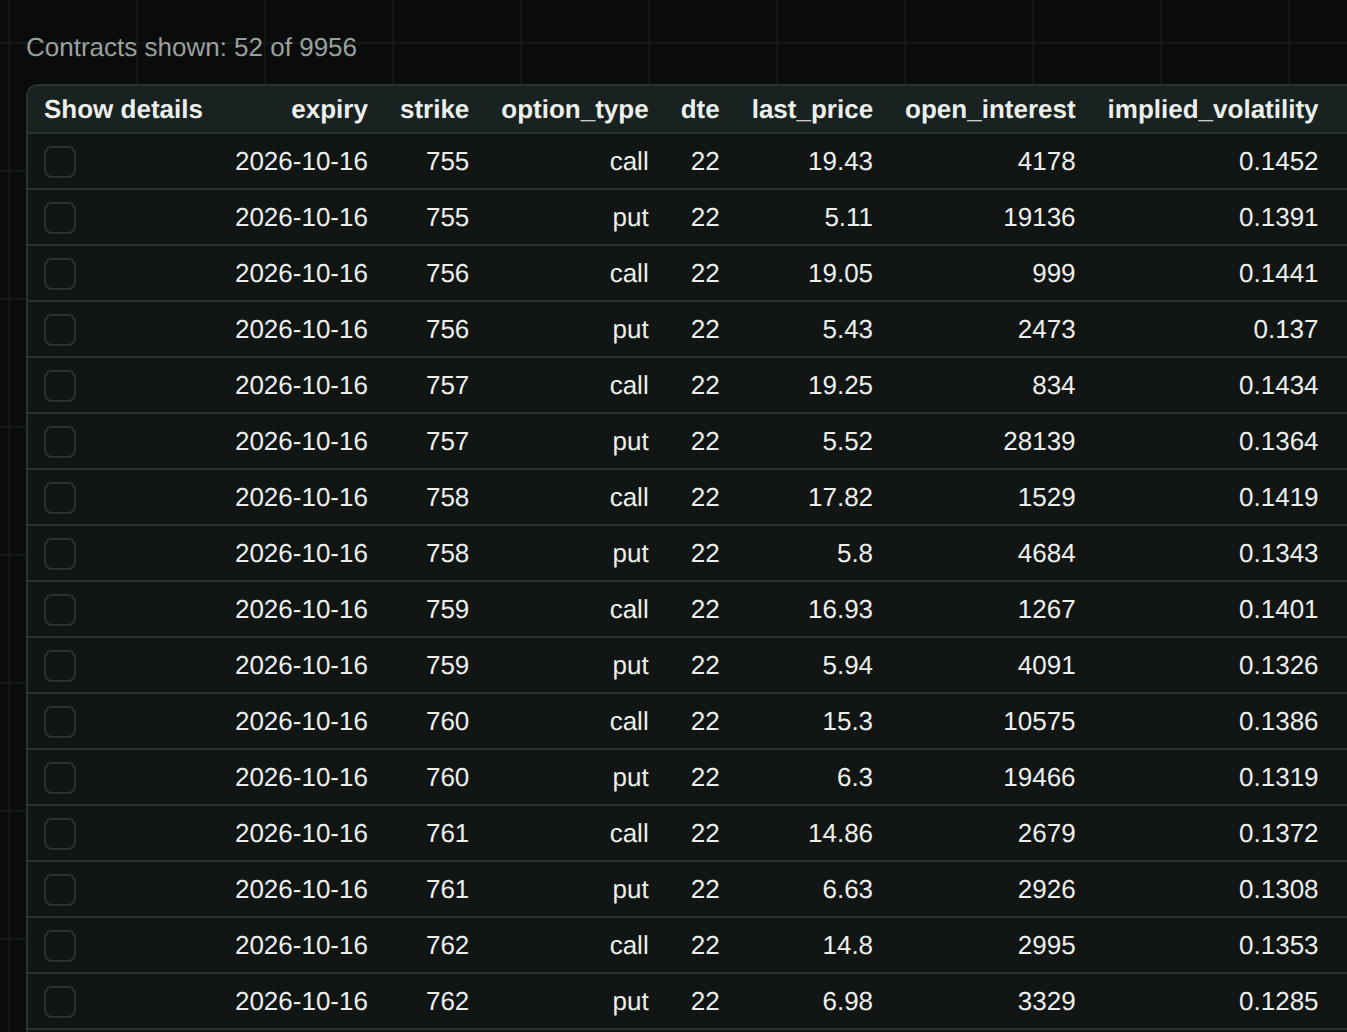
Each row is one contract. The columns you see first:
| Column | What it means |
|---|---|
| expiry | the last day the contract exists — here 16 October 2026 |
| strike | the fixed price in the contract |
| option_type | call or put |
| dte | days to expiry — how long the contract has left |
| last_price | the price of the last trade, per share; one contract is 100 shares |
| open_interest | how many of these contracts are open right now |
| implied_volatility | how much movement the price of the option assumes, as a fraction a year: 0.1386 is 13.86% — lesson 3 |
Read one row out loud
Take the 760 call: last price 15.30, open interest 10,575.
Out loud: "The right to buy SPY at 760 until 16 October last traded at $15.30 a share — $1,530 for one contract — and 10,575 of these contracts are open."
Now the 760 put on the next line: last price 6.30, open interest 19,466. "The right to sell SPY at 760 until 16 October costs $6.30 a share, and almost twice as many of them are open as the calls at the same strike."
Why the call costs more: SPY was at 767.34, so the right to buy at 760 is already worth about $7 a share on its own. The put at 760 is only worth something if SPY falls below 760 before 16 October, so all of its price is a bet on what might happen.
Open interest and volume are different things
Open interest counts contracts that exist and have not been closed. It is counted once a day, after the close, and it is what gamma exposure, max pain and the walls are built from.
Volume counts how many contracts traded today. A contract can trade ten thousand times in a day and end with the same open interest, if buyers and sellers were just passing it back and forth. Volume is what unusual activity is built from — lesson 9.
Keep these two apart and half of the confusion around options dashboards disappears.
In the money, out of the money
With SPY at 767.34:
- the 760 call is in the money — its strike is below the price, so the right to buy at 760 is already worth something;
- the 760 put is out of the money — its strike is below the price, so the right to sell at 760 is worth nothing if SPY stays where it is;
- a strike close to the price is at the money.
You will see these words everywhere. They only ever mean where the strike sits against the current price.
Open SPY in the demo and look at the list of expiries on the Max Pain / GEX view — each one is a separate slice of the chain. The full table of every contract is the Screener view, which needs a free account.
Open the demo →What this does not tell you
Does a big open interest mean people are betting on that price?
Not necessarily. Every open contract has a buyer and a seller, so open interest counts positions, not opinions. Many puts are insurance on shares, not a bet on a fall.
Is the last price what I would pay right now?
No. It is the price of the last trade, which can be minutes or hours old on a quiet contract. What you would actually pay is the current ask, which GammaGrid does not show — the data is delayed.
Why are there so many expiries?
Because different people need different horizons: same-day contracts for day traders, monthly ones for most positions, contracts a year or more out for long-term hedges. GammaGrid's levels use the expiries in the next 30 days — lesson 6 explains why that window matters.
Read these levels on your own tickers
GammaGrid computes the walls, the flip and the gamma weather for any US-listed ticker with options, keeps every chain it collects, and shows you what changed since yesterday. Free while it is in beta.
Open GammaGrid →Or look around first, no sign-in: the live demo