Reading Positioning Day to Day: A Five-Minute Routine
Everything in this guide comes together in one question you can answer in five minutes: what changed since yesterday, and does it matter? Here is the routine, step by step, on a real day when SPY's gamma regime flipped.
Every number in this guide is a level: a wall, a flip, a max pain, a ratio. A level on its own is a coordinate. What you can act on — or at least notice — is a level that moved. So the routine starts with one question: what changed since yesterday?
Step 1: one screen, two days
GammaGrid's Changes view puts two trading days side by side, each read at its last snapshot: the earlier day, the later day, and how each figure moved. The default pair is the previous trading day and the latest.
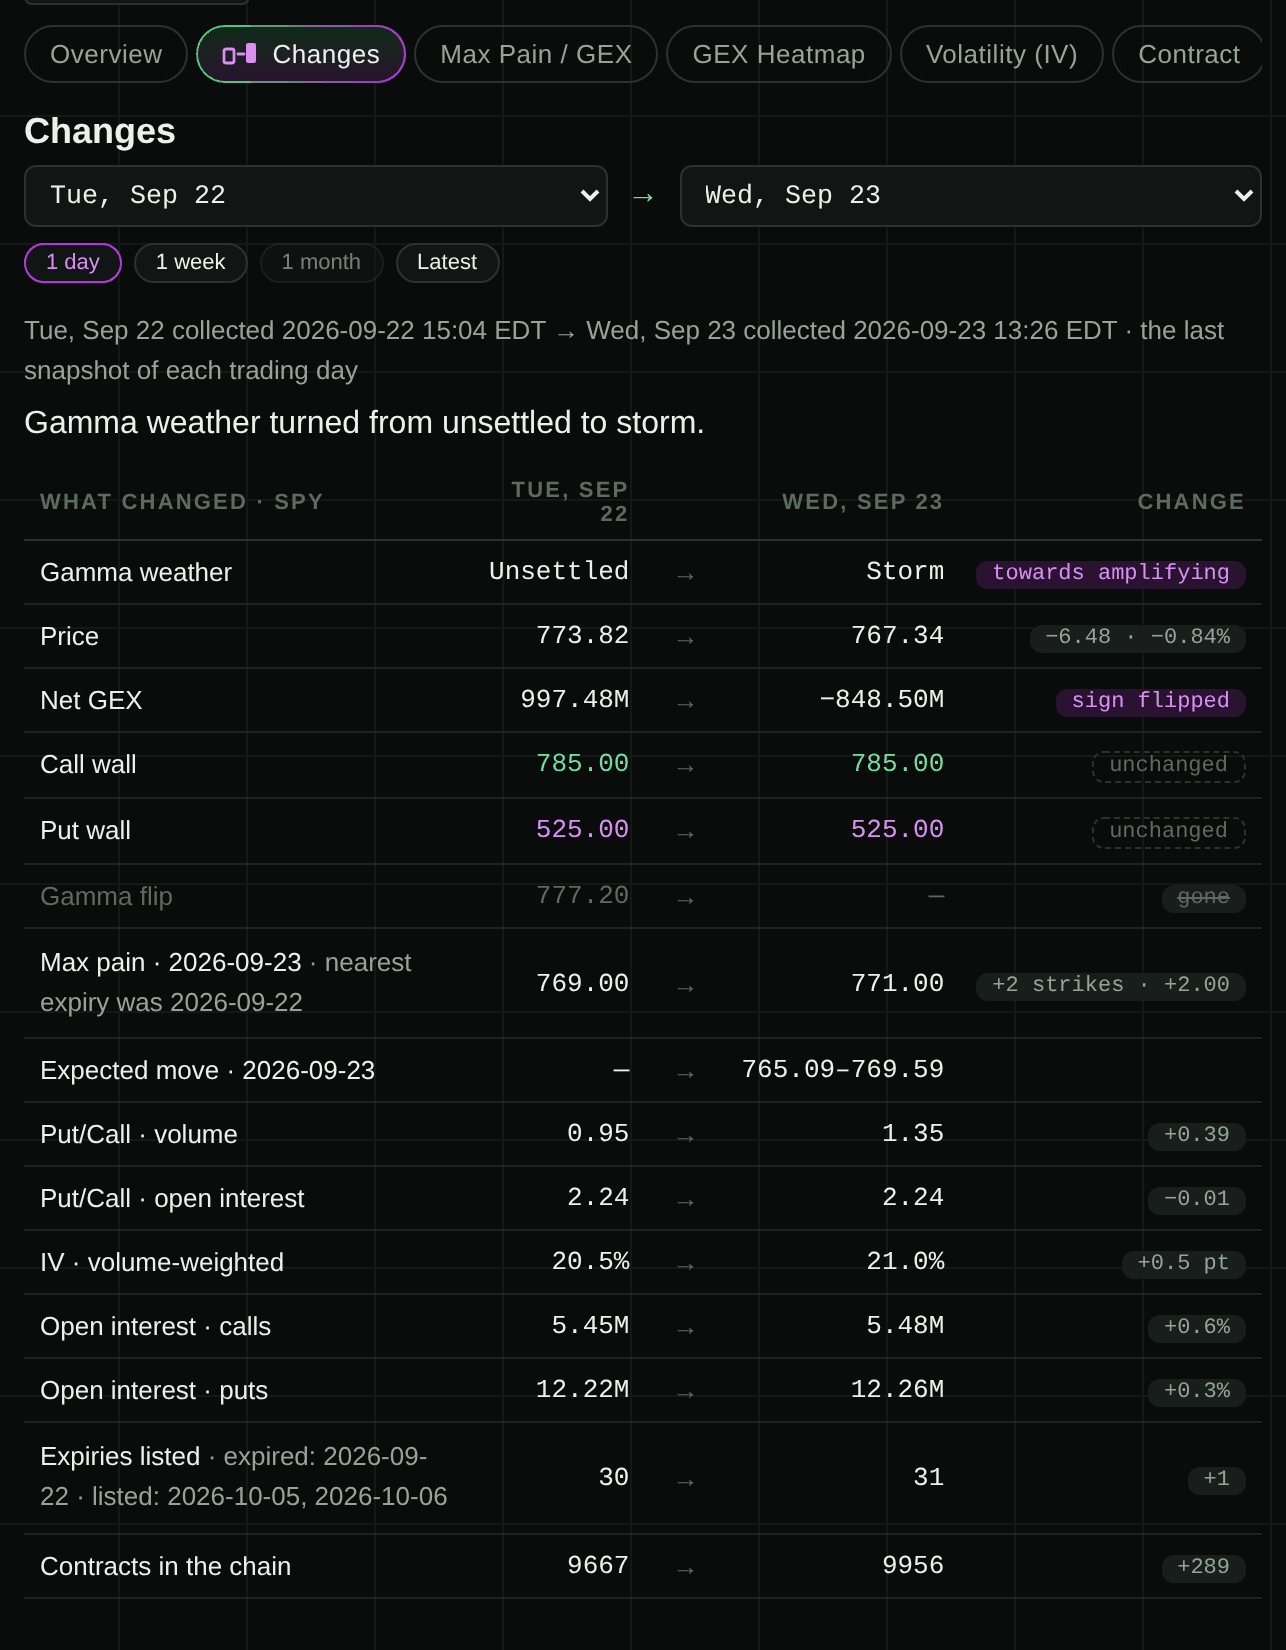
Here is SPY, 22 → 23 September 2026:
Step 2: read the headline, then only the colour
The headline says the most important thing first: "Gamma weather turned from unsettled to storm."
Then skip everything in plain ink and read only the coloured chips. Colour means the regime moved — green towards damping, purple towards amplifying:
- Gamma weather: Unsettled → Storm, towards amplifying. On 22 September the price was sitting near the flip (lesson 6); on 23 September there was no flip at all.
- Net GEX: +$997 million → −$849 million, sign flipped. Dealer gamma went from positive to negative (lesson 5): hedging that was leaning against moves is now leaning with them.
Two chips, one story: SPY fell $6.48 (−0.84%) and crossed from the damping side to the amplifying side.
Step 3: check what did not change
The plain and dashed chips matter too — "unchanged" is information.
- Call wall 785, put wall 525: unchanged. The regime flipped without the walls moving. The put wall is still almost a third below the price, too far away to matter this week (lesson 6).
- Gamma flip: 777.20 → gone. Not a move — the running total no longer crosses zero anywhere near the price.
- Max pain for the 23 September expiry: 769 → 771, up two strikes, while the price fell. It is compared for the same expiry only; the line says so when the nearest expiry has just rolled off (lesson 4).
- Put/call by volume 0.95 → 1.35, by open interest 2.24 → 2.24. Puts traded more relative to calls than the day before; the positions held did not change (lesson 2).
- IV 20.5% → 21.0%, half a point up — the market priced slightly bigger moves after the drop (lesson 3).
Step 4: see it as a picture
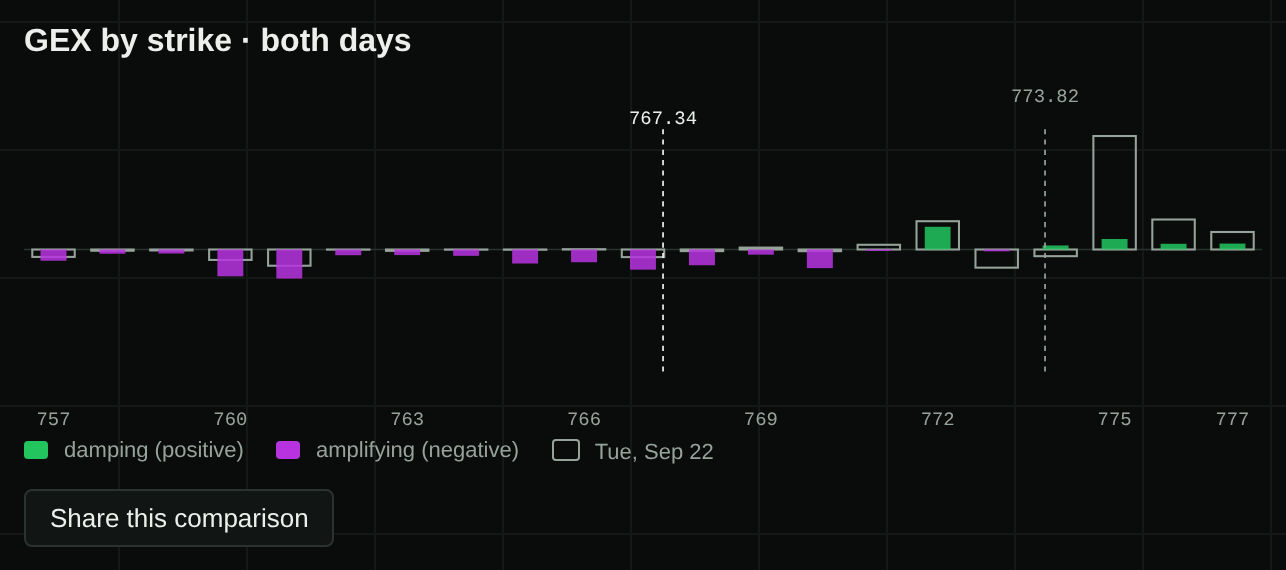
The outlines are the earlier day, the filled bars the later day, both prices dashed. You can see the price walk down from 773.82 to 767.34 into strikes where the bars are purple — the picture of "crossed to the amplifying side".
Step 5: decide where to look next
Most mornings the answer is nowhere: the weather held, the walls held, nothing is coloured. That is the most common answer, and a routine that takes thirty seconds on a quiet day is one you will keep.
When something is coloured, one more screen, not five:
| If this changed | Open | Lesson |
|---|---|---|
| The weather or net GEX | GEX Heatmap — where the green and purple sit now | 7 |
| A wall moved | OI Delta — which contracts were opened or closed behind it | 8 |
| Put/call jumped | Unusual Activity — which contracts carried the volume | 9 |
| You hold a contract | Contract — where its price went, greek by greek | 10 |
On Monday, press 1 week instead of the default pair. A wall that drifted three strikes over a week is a different story from one that jumped overnight, and the weekly pair is where slow drift shows up.
Open the Changes view for SPY or your own ticker (a free GammaGrid account) with the default pair of days. Read the headline, then only the coloured chips. Then press "1 week" and compare: which of today's changes were already there a week ago?
Open the demo →What this does not tell you
Does a regime flip mean the price will keep falling?
No. It means dealer hedging is now more likely to amplify moves in either direction. It describes how the market may move, not where.
Why read at the last snapshot of each day?
Because open interest is counted once a day, and the last snapshot is the most complete picture of that day. Two moments of the same day would compare two versions of the same open interest.
Is there a faster way?
If you use ChatGPT or Claude, you can connect GammaGrid there and ask "what changed for SPY since yesterday?" — the answer is this same ladder in a sentence. How to connect it.
Read these levels on your own tickers
GammaGrid computes the walls, the flip and the gamma weather for any US-listed ticker with options, keeps every chain it collects, and shows you what changed since yesterday. Free while it is in beta.
Open GammaGrid →Or look around first, no sign-in: the live demo