# GEX Levels in TradingView: Call Wall, Put Wall and Max Pain on Your Own Chart
> The walls, max pain and the expected move are most useful where you actually trade — on your own chart. Here is how to put them there with a free indicator, in two minutes once and fifteen seconds a day after that.
*2026-11-07 · GammaGrid Guide · Lesson 12 · *
---
Most people who read gamma levels do not trade on the page that shows them. They trade on a chart — very often a TradingView chart — and switching between two windows to remember where the call wall was is exactly the friction that makes the levels go unused.
GammaGrid's Max Pain / GEX screen has a **TradingView levels** button. It hands you one line of text with the levels of the expiry you picked, and a small free indicator draws that line on your chart. On SPY's same-day expiry at 11:27 New York time on 2 November 2026, the line was:
`GG1|SPY|2026-11-02|2026-11-02T16:27Z|yahoo|763.73,EM high,em;758,Call Wall,res;758,Max Pain,mp;756.23,EM low,em;745,Put Wall,sup`
It starts with what the levels belong to — the ticker, the expiry, when they were collected and from which source — so the indicator can warn you when they do not match the chart. Then come the levels themselves, highest first:
| Level | SPY, 2 Nov 2026 expiry | What it is |
|---|---|---|
| EM high | 763.73 | top of the one-sigma expected move to expiry |
| Call wall | 758 | the strike with the most open calls |
| Max pain | 758 | where option holders would collect the least at expiry |
| EM low | 756.23 | bottom of the expected move |
| Put wall | 745 | the strike with the most open puts |
**EM high and EM low** are the expected move: the price at collection plus and minus one standard deviation to expiry, worked out from at-the-money implied volatility (price × IV × √years to expiry). The price finishes inside that band about two times in three — so roughly one expiry in three it does not. On the chart the two lines are labelled **EM high (expected move)** and **EM low (expected move)**; hover a label for the same explanation.
The price was 759.98 — already above the call wall that morning. The popover says so when a wall is off its usual side of the price, because of how the walls are built: they are the strikes with the most open interest, not lines the price must respect ([lesson 6](https://gammagrid.io/guide/walls-and-flip/) takes them apart).
## Once: add the indicator
You need a TradingView account; the free plan is enough to save your own indicator and keep it on a chart.
1. In GammaGrid, open a ticker's **Max Pain / GEX** screen and press **TradingView levels**. At the bottom of the panel, press **Copy Pine script**.
2. In TradingView, open a chart of the same ticker.
3. At the bottom of the chart, open **Pine Editor**. In its menu choose **Create new → Indicator**, select everything in the editor and paste the script over it.
4. Press **Save**, name it **GammaGrid Levels**, then press **Add to chart**.
The indicator now sits on the chart with nothing to draw yet. Its panel in the top-right corner says **Paste levels: Settings → Levels**.
## Every day: copy the levels
1. In GammaGrid, pick the expiry you trade — the screen opens on the nearest one with time left — press **TradingView levels**, then **Copy levels**.
2. In TradingView, open the indicator's settings (the gear next to **GammaGrid Levels** on the chart), paste into **Levels** and press **OK**.
That is about fifteen seconds. Open interest is counted once a day, after the close, so walls copied before the open hold for the whole session; the price and the expected move change during the day, and you can copy again whenever you like. The levels on your chart do not update by themselves — that is how TradingView indicators work, for every tool of this kind.
The corner panel shows which ticker and expiry the lines belong to and when they were collected, in New York time.
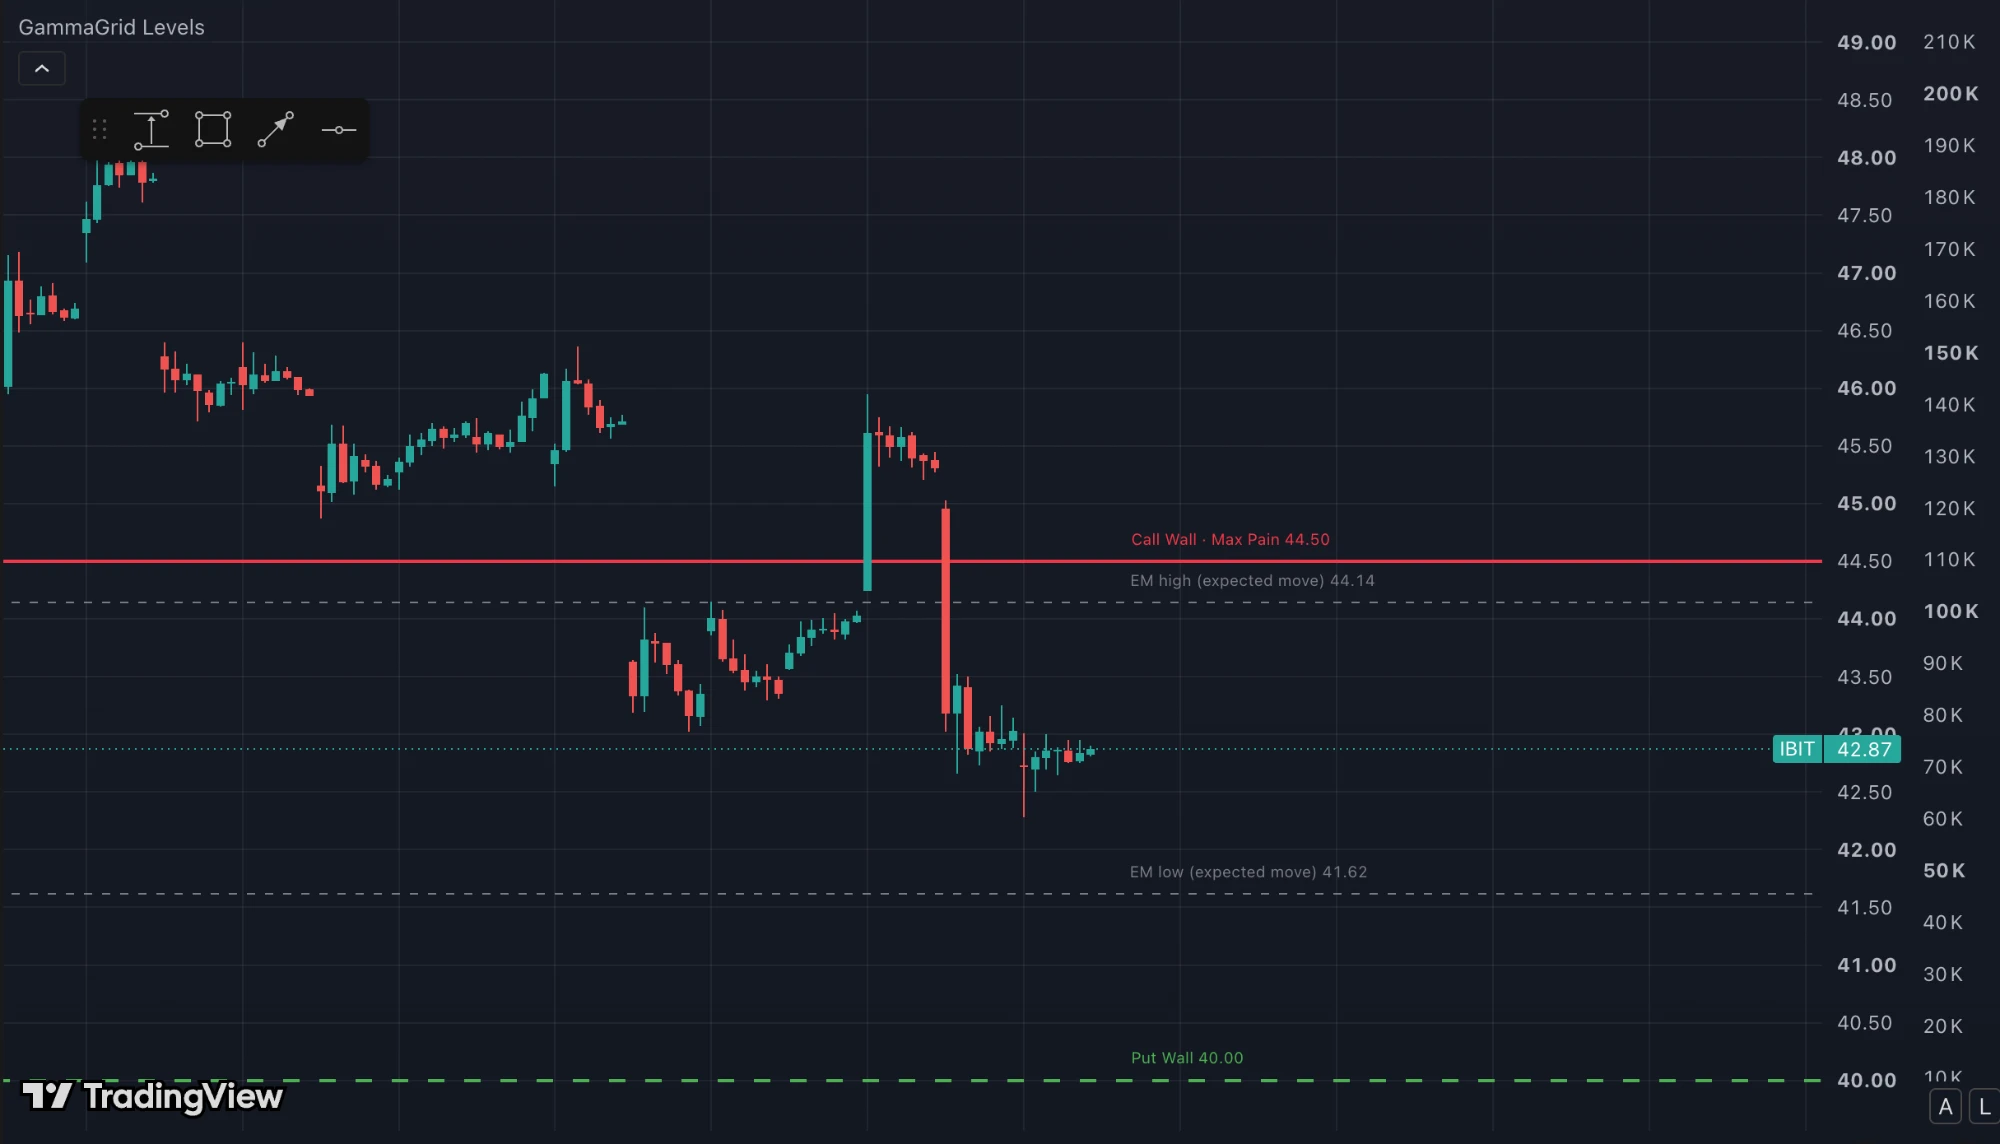
*IBIT, expiry 9 November 2026, levels collected at 03:32 New York time on 7 November 2026 and drawn by the GammaGrid Levels indicator on a TradingView one-hour chart. Call wall and max pain share the 44.50 strike, so they share one line.*
Levels on the same price share one line and one label, with prices to two decimals as in GammaGrid — in the example above the chart shows **Call Wall · Max Pain 758.00** once, in the call wall's colour: a wall outranks max pain, and both outrank the expected move. Labels sit just above their line. If you added the indicator before 7 November 2026, press **Copy Pine script** again and paste it over the old one in Pine Editor — your saved levels line keeps working either way. A **Download CSV** button next to **Copy levels** gives the same numbers as a table, for anything that is not this indicator.
> **Data.**
> The levels come from GammaGrid's fifteen-minute collection of the options chain. On Yahoo the options themselves are quoted fifteen minutes late, and the panel says when the levels were collected.
## SPX levels on an ES chart
Many same-day traders watch the ES future rather than SPX itself, and futures trade at a premium to the index — the basis. SPX levels on an ES chart would sit a few dozen points too low.
The indicator has an **Offset** field for this. Work out the basis yourself — ES price minus SPX price at the same moment — and type it in; every line moves up by that much, while the labels keep the SPX numbers you see in GammaGrid. The panel then reads, for example, **^SPX levels, offset 32.5**. The same works for NDX on an NQ chart.
## What this does not tell you
### What happens if I paste the levels on the wrong chart?
The lines are still drawn, and the corner panel says **Levels are for SPY** in orange. With an offset set it says which ticker's levels you are looking at instead, since that is then on purpose.
### What happens the day after the expiry?
The indicator compares the expiry in the line with the date of the chart's last bar. Once the expiry has passed, the lines turn pale and dotted and the panel reads **Expired Nov 2 — copy today's levels**. Nothing is wrong with them; they simply describe a contract that no longer exists.
### Why can't I copy the levels of some expiries?
An expiry with too little open interest is refused: its walls would rest on a handful of contracts and look exactly as solid on a chart as SPY's. Pick an expiry with more open contracts.
### Are the walls support and resistance?
Not by themselves. They are where the most contracts are open, and dealer hedging around them can slow the price down — or not. The [walls lesson](https://gammagrid.io/guide/walls-and-flip/) explains how to read them together with the gamma flip.
**Try it on the live demo:** Open SPY's Max Pain / GEX screen with a free GammaGrid account, press TradingView levels, and follow the steps below on your own chart. Then pick a later expiry and copy again — see which lines move and which stay.
Read next: ·
---
Source: https://gammagrid.io/guide/tradingview-levels/
GammaGrid — options positioning dashboard. Educational content, not investment advice.