# The Put/Call Ratio, Explained Simply
> One number that compares puts with calls — and two versions of it that answer different questions. Why the level matters less than the change, and how to tell a real shift from a glitch.
*2026-09-24 · GammaGrid Guide · Lesson 2 · *
---
The **put/call ratio** divides something about puts by the same thing about calls. Above 1, there is more on the put side; below 1, more on the call side. It is one of the oldest sentiment gauges in options, and the easiest to misread.
## Two ratios, two questions
**By volume:** puts traded today ÷ calls traded today. It answers *"what did people do today?"* It moves a lot, because one large trade can swing it.
**By open interest:** puts open ÷ calls open. It answers *"what is being held?"* It moves slowly, because open interest is counted once a day and builds up over weeks.
GammaGrid draws both on one chart. On NVDA, the snapshot after the close on 23 September 2026 read **0.56 by volume** and **0.86 by open interest**: calls traded almost twice as much as puts that day, while the positions held were closer to even.
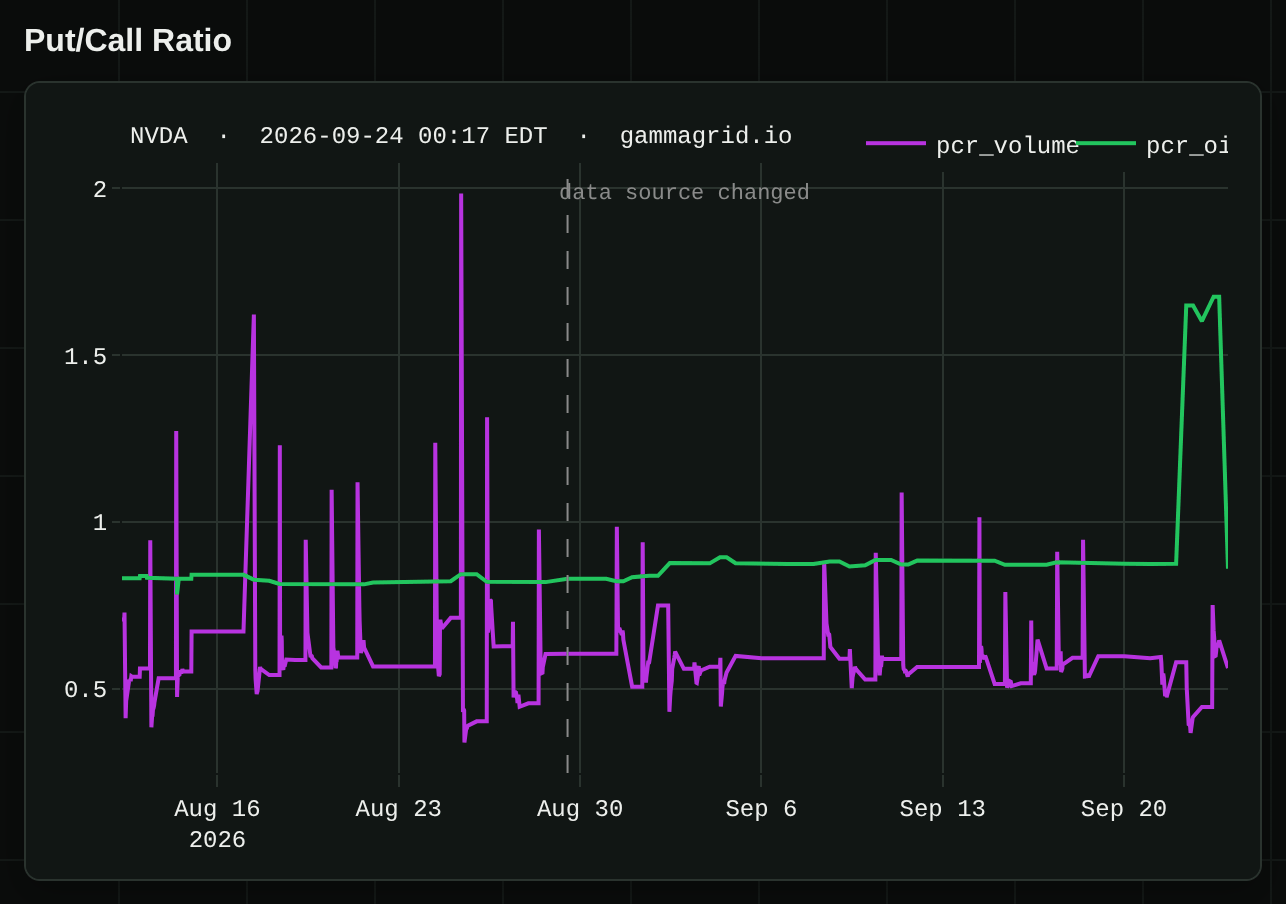
*NVDA on the Overview view of the GammaGrid demo: put/call by volume (purple) and by open interest (green) since 12 August 2026. The dashed line marks the day the data source changed. Snapshot after the 23 September close.*
## The rule of thumb, and why it is not enough
The usual rule: a ratio noticeably above 0.7–1.0 means a defensive, bearish mood; below, a bullish one. It is a starting point, nothing more, for two reasons.
**Every ticker has its own normal.** Index products like SPY carry a lot of protective puts all the time, so their ratio by open interest sits well above 1 even when nobody is worried — on 23 September SPY read 2.24. A single stock like NVDA has more call buyers and sits lower: its median by open interest since August was 0.84.
**Puts are not all bets.** Many are insurance on shares people own and have no intention of selling. A high ratio can mean fear, or it can mean a lot of careful owners.
So the question to ask is not *"is it above 1?"* but *"is it far from where this ticker usually sits?"*
## Reading NVDA's chart
From 1 to 21 September NVDA's ratio by open interest stayed between 0.83 and 0.89 — a flat line. On 22 and 23 September it jumped to 1.65 and 1.68 during the session. The snapshot after the close on 23 September put it back at 0.86.
That shape — a sudden jump that disappears a day later — is the one to treat with suspicion. Open interest is counted once a day, so a real shift in positioning does not usually appear and vanish overnight. A jump like this can be a gap in the delayed data as easily as a change of mind. Before you read it as sentiment, check the next day, and check whether the other line moved too — the volume ratio barely changed.
The volume line tells a different story: it jumps around every day, twice in August it spiked above 1.5 — almost to 2 — and each time it fell back. That is normal for volume — one day of heavy put buying is one day. What matters is a run of days in the same direction.
**Try it on the live demo:** Open NVDA in the demo — the put/call chart is the first thing on the Overview. Compare today's two values with where each line has sat for the past weeks, not with 1.0.
## What this does not tell you
### Does a high put/call ratio mean the price will fall?
No. It tells you how puts compare with calls, not where the price goes next. A lot of put buying is hedging by people who expect to keep their shares.
### Which of the two ratios should I watch?
Both, for different things. Volume shows today's activity and reacts fast; open interest shows what is held and reacts slowly. When both move the same way for several days, that is worth noticing.
### Can I compare the ratio of two different tickers?
Only loosely. Each ticker has its own normal level, so compare each one with its own history rather than with each other.
Read next: ·
Next lesson: [Implied Volatility, Skew and the Expected Move, Explained Simply](https://gammagrid.io/guide/implied-volatility/)
---
Source: https://gammagrid.io/guide/put-call-ratio/
GammaGrid — options positioning dashboard. Educational content, not investment advice.