# The Options Chain: Strikes, Expiries, Calls, Puts and Open Interest
> Every number on a gamma exposure dashboard is built from one table — the options chain. Here is what is in it, column by column, and how to read a single row out loud.
*2026-09-24 · GammaGrid Guide · Lesson 1 · *
---
An **option** is a contract that gives its buyer the right to buy or sell 100 shares of a stock at a fixed price, until a fixed date. That is all you need to start. Everything a gamma exposure dashboard shows — walls, flips, max pain, put/call — is arithmetic over one big table of those contracts, called the **options chain**.
## Two kinds of contract
A **call** is the right to *buy* the shares at the fixed price. People buy calls when they think the price will go up, or to cap what they would pay later.
A **put** is the right to *sell* the shares at the fixed price. People buy puts when they think the price will fall, or — very often — as insurance on shares they already own.
Every contract has a buyer and a seller. The buyer pays for the right; the seller takes the money and the obligation.
## Two numbers that define a contract
The **strike** is the fixed price in the contract. A SPY 760 call is the right to buy SPY at $760.
The **expiry** is the last day the contract exists. After it, the contract is settled and gone.
A chain lists every strike for every expiry, calls and puts side by side. SPY is one of the busiest chains there is: on 23 September 2026 GammaGrid collected 9,956 SPY contracts across 31 expiries, from the same day out to years ahead. Nobody reads all of them. You pick a slice.
## One slice of a real chain
Here is a slice from GammaGrid's Screener: the SPY expiry of 16 October 2026, strikes 755 to 762, with SPY at 767.34.
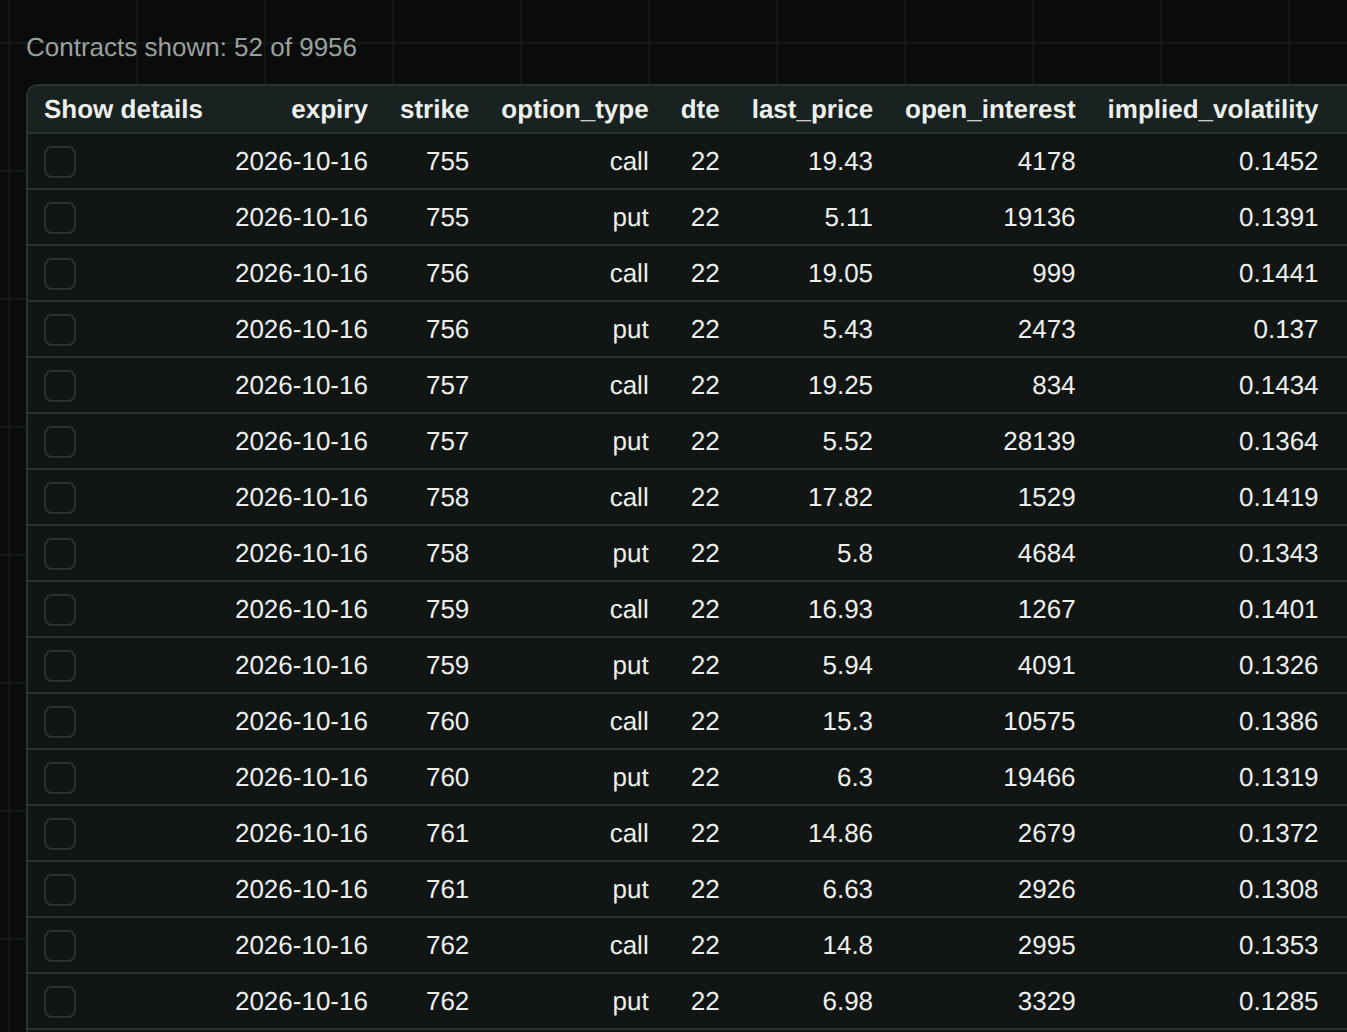
*SPY in GammaGrid's Screener, filtered to the 16 October expiry and strikes 755–762. Collected at 13:26 New York time on 23 September 2026, SPY at 767.34.*
Each row is one contract. The columns you see first:
| Column | What it means |
|---|---|
| expiry | the last day the contract exists — here 16 October 2026 |
| strike | the fixed price in the contract |
| option_type | call or put |
| dte | days to expiry — how long the contract has left |
| last_price | the price of the last trade, per share; one contract is 100 shares |
| open_interest | how many of these contracts are open right now |
| implied_volatility | how much movement the price of the option assumes, as a fraction a year: 0.1386 is 13.86% — lesson 3 |
## Read one row out loud
Take the 760 call: last price 15.30, open interest 10,575.
Out loud: *"The right to buy SPY at 760 until 16 October last traded at $15.30 a share — $1,530 for one contract — and 10,575 of these contracts are open."*
Now the 760 put on the next line: last price 6.30, open interest 19,466. *"The right to sell SPY at 760 until 16 October costs $6.30 a share, and almost twice as many of them are open as the calls at the same strike."*
Why the call costs more: SPY was at 767.34, so the right to buy at 760 is already worth about $7 a share on its own. The put at 760 is only worth something if SPY falls below 760 before 16 October, so all of its price is a bet on what might happen.
## Open interest and volume are different things
**Open interest** counts contracts that exist and have not been closed. It is counted once a day, after the close, and it is what gamma exposure, max pain and the walls are built from.
**Volume** counts how many contracts traded today. A contract can trade ten thousand times in a day and end with the same open interest, if buyers and sellers were just passing it back and forth. Volume is what unusual activity is built from — lesson 9.
Keep these two apart and half of the confusion around options dashboards disappears.
## In the money, out of the money
With SPY at 767.34:
- the 760 **call** is *in the money* — its strike is below the price, so the right to buy at 760 is already worth something;
- the 760 **put** is *out of the money* — its strike is below the price, so the right to sell at 760 is worth nothing if SPY stays where it is;
- a strike close to the price is *at the money*.
You will see these words everywhere. They only ever mean where the strike sits against the current price.
**Try it on the live demo:** Open SPY in the demo and look at the list of expiries on the Max Pain / GEX view — each one is a separate slice of the chain. The full table of every contract is the Screener view, which needs a free account.
## What this does not tell you
### Does a big open interest mean people are betting on that price?
Not necessarily. Every open contract has a buyer and a seller, so open interest counts positions, not opinions. Many puts are insurance on shares, not a bet on a fall.
### Is the last price what I would pay right now?
No. It is the price of the last trade, which can be minutes or hours old on a quiet contract. What you would actually pay is the current ask, which GammaGrid does not show — the data is delayed.
### Why are there so many expiries?
Because different people need different horizons: same-day contracts for day traders, monthly ones for most positions, contracts a year or more out for long-term hedges. GammaGrid's levels use the expiries in the next 30 days — lesson 6 explains why that window matters.
Read next: ·
Next lesson: [The Put/Call Ratio, Explained Simply](https://gammagrid.io/guide/put-call-ratio/)
---
Source: https://gammagrid.io/guide/options-chain/
GammaGrid — options positioning dashboard. Educational content, not investment advice.