# Option Greeks Explained Simply: Where Your Option's Price Went
> Four greeks, each one answering "how much of the price change came from this". Here they are in plain words, and then applied to a real SPY call that lost a third of its value while SPY went up.
*2026-09-24 · GammaGrid Guide · Lesson 10 · *
---
An option's price moves for more than one reason at once. The **greeks** are the names for those reasons, each written as "how much the price changes when one thing changes and nothing else does".
## The four greeks, in one line each
| Greek | What changes | Plain words |
|---|---|---|
| **Delta** | the stock price, by $1 | how many dollars the option moves per dollar of the stock — 0.53 means about 53 cents |
| **Gamma** | the stock price, again | how fast delta itself changes — why a big move pays more than delta alone says |
| **Theta** | one day passes | how much value the option loses per day just from time running out |
| **Vega** | implied volatility, by 1 point | how much the option gains when the market prices bigger moves — lesson 3 |
Each one is an answer to "what if only this changed". In real life everything changes at once, so the useful question is the reverse one: *given what the price did, how much came from each?*
## A real contract: SPY 767 call, expiring 24 September 2026
The contract: the right to buy SPY at 767 until 24 September. One week of GammaGrid's own collection:
| | 14 Sep (afternoon) | 23 Sep (13:26 New York) |
|---|---|---|
| SPY | 761.81 | 767.34 |
| The call, per share | $3.54 | $2.34 |
SPY went up by $5.53. The call — a bet on SPY going up — lost $1.20 a share, 34% of its value. Right on direction, and still a loss. The greeks say why.
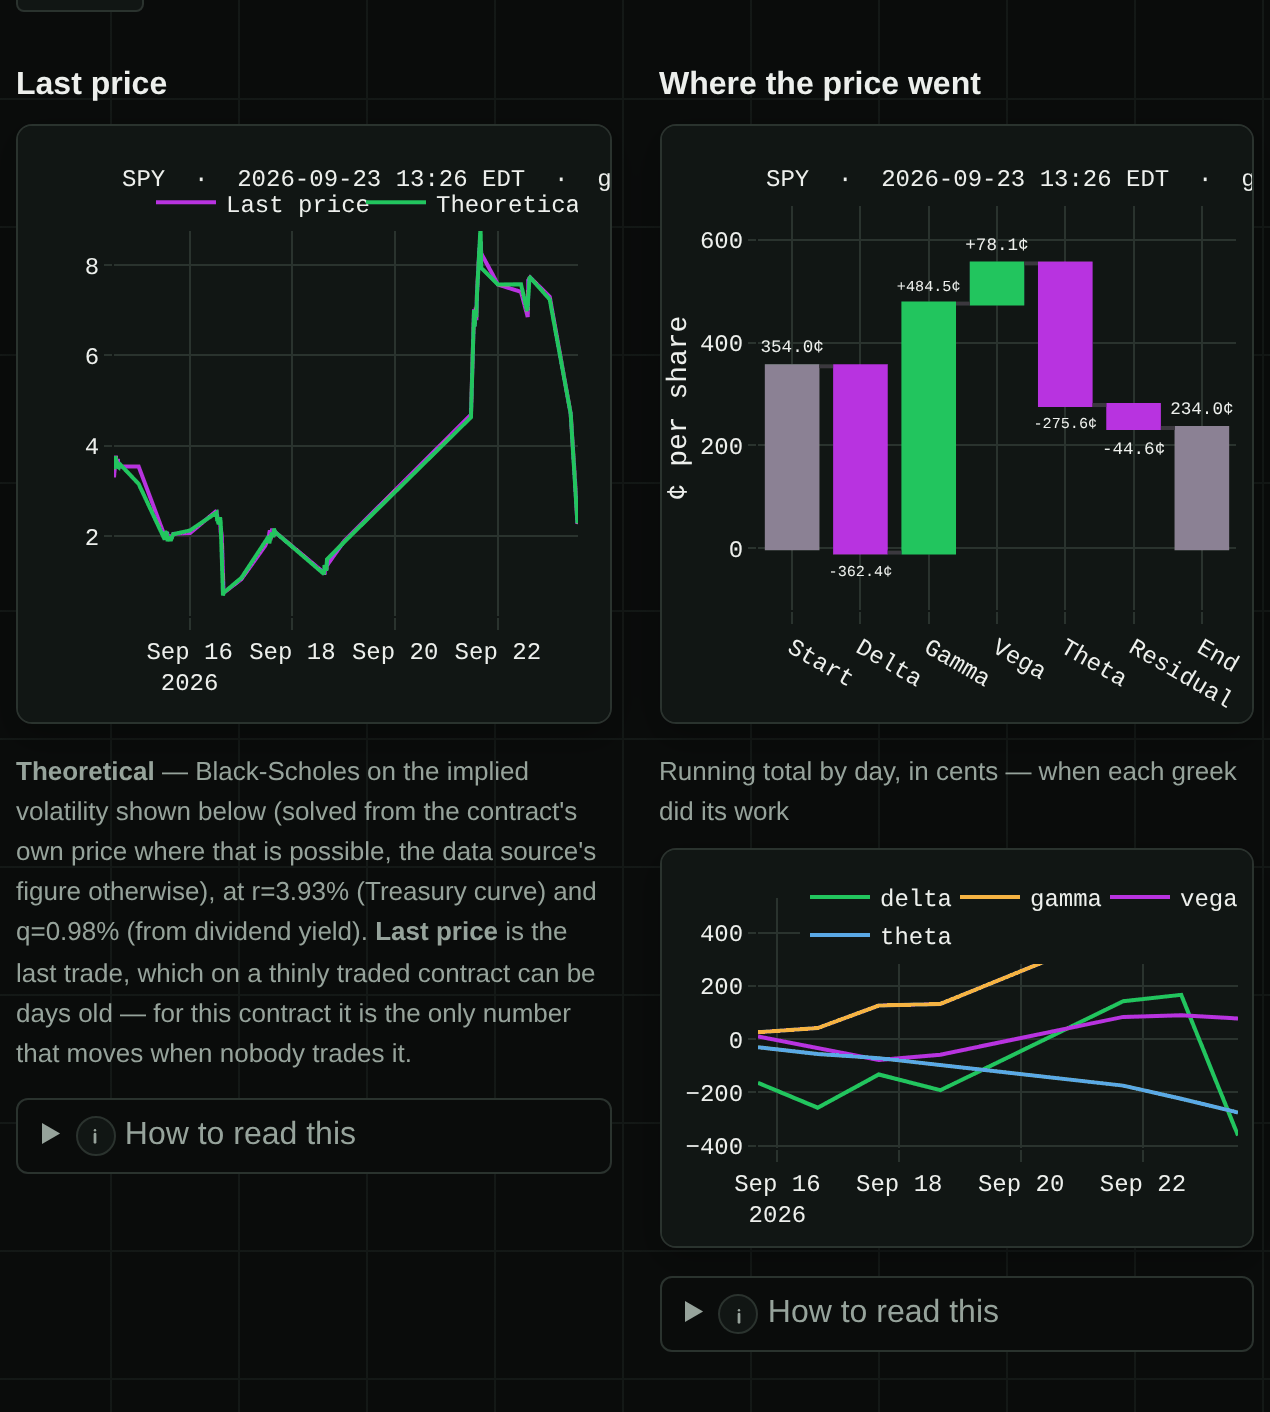
*The SPY 24 September 767 call on GammaGrid's Contract view: the price history on the left, "Where the price went" on the right, in cents per share. Collected 14–23 September 2026, last snapshot at 13:26 New York time on 23 September.*
## Reading "Where the price went"
The waterfall starts at the first price, 354 cents, and adds one bar per greek until it reaches the last price, 234 cents. Per share:
| Part | Change | What it means here |
|---|---|---|
| Delta | −$3.62 | the price moves, measured with each day's delta |
| Gamma | +$4.84 | the correction for delta changing as the price moved |
| Vega | +$0.78 | implied volatility rose from 11% to 13% |
| Theta | −$2.76 | nine days of time passing on a one-week option |
| Residual | −$0.45 | what the model does not explain — spreads, stale prices |
| **Total** | **−$1.20** | $3.54 → $2.34 |
Read delta and gamma together: they are both the price. Between them they added **+$1.22** — SPY's rise did help. Delta on its own is negative because of the path: SPY fell early in the week while delta was small, jumped on 21 September, and then fell $6.48 on 23 September when delta was large (0.82 the evening before). Gamma is the piece that accounts for delta growing and shrinking along the way.
Then theta: **−$2.76**. That is the whole story. A contract one week from expiry loses value every day, and by the end theta was taking about $0.99 a day. The move in SPY was real but small, and time took more than the move gave.
The residual is shown always, even though it is not flattering. A breakdown that hides its own error is one you cannot check.
## Day by day
The chart under the waterfall runs the same split as a running total by day. The biggest single day was 21 September: SPY rose from 761.69 to 773.51, and the call went from $1.89 to $8.26 — delta, gamma and vega all pushing the same way. Two sessions later most of it was gone. For a short-dated option, one good day and the next bad one can decide the whole trade.
**Try it on the live demo:** Open the Contract view for a ticker you follow (a free GammaGrid account), pick an expiry a week or two away and a strike near the price. In "Where the price went", which bar is the biggest — and is it the one you would have guessed?
## What this does not tell you
### Is this my profit and loss?
It is the contract's, per share. Multiply by 100 and by how many contracts you hold. No entry price is needed or asked for — the split is a property of the contract over the window, not of your position.
### Why is the residual not zero?
Because the greeks describe small changes, and real prices move in jumps, trade at a spread and are sometimes stale. The residual is that gap, shown instead of hidden.
### Where do these greeks come from?
GammaGrid calculates them itself from the delayed chain, with the Black-Scholes model, each time it collects. They are an estimate like any greeks — close enough to explain a price, not a quote from the exchange.
Read next: ·
Next lesson: [Reading Positioning Day to Day: A Five-Minute Routine](https://gammagrid.io/guide/daily-routine/)
---
Source: https://gammagrid.io/guide/option-greeks-and-price/
GammaGrid — options positioning dashboard. Educational content, not investment advice.